Understanding Histograms: Analysis and Application in Real-World Data
In this lesson, students will explore the concepts of mean, median, mode, and range through engaging examples. They will learn how to construct and analyze histograms from various datasets, such as hours of sleep and TV watching habits. The lesson includes practice quizzes to reinforce the material, helping students understand how to interpret graphical data representations and calculate central tendencies. By the end of the lesson, learners will be equipped to use histograms effectively and answer questions based on them.

Understanding Histograms: Analysis and Application in Real-World Data
E N D
Presentation Transcript
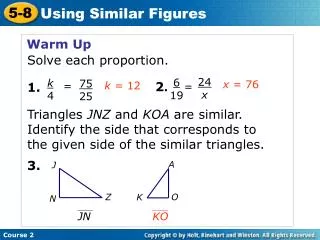
Warm Up Problem of the Day Lesson Presentation Lesson Quizzes Course 2
Warm Up Find the mean, median, mode, and range for the data set. 35, 45, 48, 53, 53, 27, 66, 36, 24 43; 45; 53; 42
Problem of the Day Which number does not belong with the others? Why? 81, 64, 36, 27, 49 Possible answer: 27; the others are perfect squares.
Sunshine State Standards Prep for MA.7.S.6.2 Construct and analyze histograms….
Vocabulary histogram
A histogram is a bar graph that shows the frequency of data within equal intervals. There is no space between the bars in a histogram.
Additional Example 1A: Analyzing Histograms The histogram shows the results of a survey asking people the number of hours they sleep per night. Use the histogram to answer each question. A. How many people sleep less than 9 hous per night? Add the number of students in the 3-5 and 6-8 intervals. 23 + 58 = 78 78 people sleep less than 9 hous per night.
Additional Example 1B: Analyzing Histograms B. What is the approximate median number of hours people sleep per night? Since 100 people were surveyed, the median is the mean of the 50th and 51st persons’ hours. Determine the interval of the 50th and 51st people. The 50th and 51st persons’ hours are in the middle of the 6-8 interval. So, a good estimated is 7 hours.
Check It Out: Example 1A The histogram shows the results of a local 10K race. Use the histogram to answer each question. A. How many runners completed the race in less than 50 minutes? Add the number of runners in the first four intervals. 4 + 6 + 10 + 13 = 33 33 runners completed the race in less than 50 minutes.
Check It Out: Example 1B B. What is the approximate median time people ran the race? Since there were 50 runners, the median is the mean of the 25th and 26th times. Determine the interval of the 25th and 26th times. The 25th and 26th times are in the middle of the 45:00-49:59 interval. So, a good estimated is 47:30.
Number of Hours of TV 1 // 2 //// 3 //// //// 4 //// / 5 //// /// 6 /// 7 //// //// 8 /// 9 //// Frequency Number of Hours of TV Additional Example 2: Making a Histogram The table below shows the number of hours students watch TV in one week. Make a histogram of the data. Step 1: Make a frequency table of the data. Be sure to use equal intervals. 1–3 15 17 4–6 7–9 17
Frequency Number of Hours of TV 1–3 15 17 4–6 7–9 17 Additional Example 2 Continued Step 2: Choose an appropriate scale and interval for the vertical axis. The greatest value on the scale should be at least as great as the greatest frequency. 20 16 12 8 4 0
Frequency Number of Hours of TV 1–3 15 17 4–6 7–9 17 Caution! Because the intervals are equal, all of the bars should have the same width. Additional Example 2 Continued Step 3: Draw a bar graph for each interval. The height of the bar is the frequency for that interval. Bars must touch but not overlap. 20 16 12 8 4 0
Frequency Number of Hours of TV 1–3 15 17 4–6 7–9 17 Additional Example 2 Continued Step 4: Label the axes and give the graph a title. Hours of Television Watched 20 16 12 8 4 0 Frequency 7–9 1–3 4–6 Hours
Number of Hats Owned Frequency 1 // 2 //// 3 //// / 4 //// / 5 //// /// 6 //// 7 //// / 8 //// //// 9 //// //// Frequency Number of Hats Owned Check It Out: Example 2 The table below shows the number of hats a group of students own. Make a histogram of the data. Step 1: Make a frequency table of the data. Be sure to use equal intervals. 1–3 12 18 4–6 7–9 24
Frequency Number of Hats Owned Check It Out: Example 2 Continued Step 2: Choose an appropriate scale and interval for the vertical axis. The greatest value on the scale should be at least as great as the greatest frequency. 30 25 20 15 10 5 0 1–3 12 18 4–6 7–9 24
Frequency Number of Hats Owned Check It Out: Example 2 Continued Step 3: Draw a bar graph for each interval. The height of the bar is the frequency for that interval. Bars must touch but not overlap. 30 25 20 15 10 5 0 1–3 12 18 4–6 7–9 24
Frequency Number of Hats Owned Check It Out: Example 2 Continued Number of Hats Owned Step 4: Label the axes and give the graph a title. 30 25 20 15 10 5 0 Frequency 1–3 12 18 4–6 7–9 24 7–9 1–3 4–6 Number of Hats
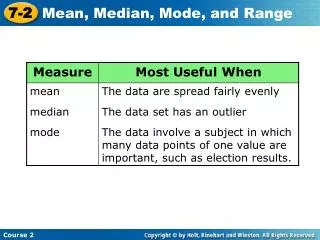
Lesson Quizzes Standard Lesson Quiz Lesson Quiz for Student Response Systems
Lesson Quiz: Part I Use the histogram to answer each question. 1. How many entrees cost $10 or more? 2. Sarah wants to go to a restaurant where most entrees are less than $10. Should she go to the restaurant whose entrees are represented in the graph? Explain. 29 No; 11 entrees are less than $10, but 29 are more.
Number of Laps Run 8 6 4 2 0 Number of Students 0–4 5–9 15–19 10–14 Number of Laps Lesson Quiz: Part II 4. The list shows the number of laps students ran one day. Make a histogram of the data. 4, 7, 9, 12, 3, 6, 10, 15, 12, 5, 18, 2, 5, 10, 7, 12, 11, 15
Lesson Quiz for Student Response Systems 1. How many students scored below 80? A. 6 B. 13 C. 19 D. 37
Lesson Quiz for Student Response Systems 2. How many students took the final exam? A. 20 B. 50 C. 60 D. 100