Performance Tuning for Programmers: An Essential Roadmap to Optimize Your Code
In our class, we explored the intricate relationship between high-level languages and assembly code, delving into processor design, pipelining, memory systems, and I/O. The pivotal next step is performance tuning. This course will guide programmers on making their programs faster through profiling, identifying bottlenecks, and optimizing efficiently. We'll cover the use of better algorithms, exploiting processor capabilities, and instrumenting programs. Tools like Gprof and Gcov will be highlighted to measure execution time and identify hotspots. Let’s create efficient code by capturing data and continuously iterating.

Performance Tuning for Programmers: An Essential Roadmap to Optimize Your Code
E N D
Presentation Transcript
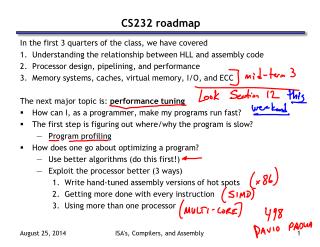
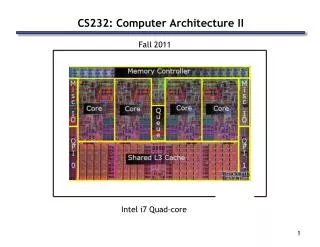
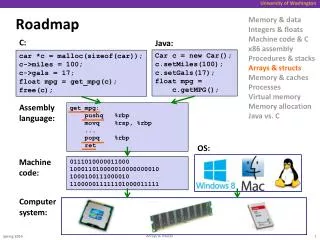
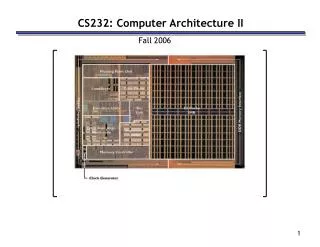
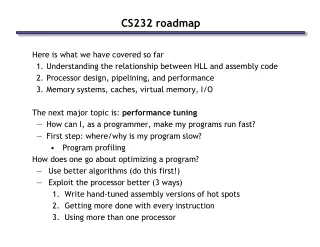
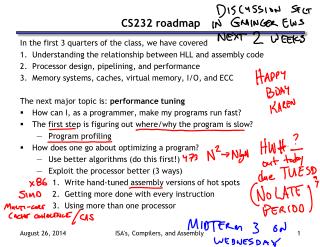
CS232 roadmap In the first 3 quarters of the class, we have covered • Understanding the relationship between HLL and assembly code • Processor design, pipelining, and performance • Memory systems, caches, virtual memory, I/O, and ECC The next major topic is: performance tuning • How can I, as a programmer, make my programs run fast? • The first step is figuring out where/why the program is slow? • Program profiling • How does one go about optimizing a program? • Use better algorithms (do this first!) • Exploit the processor better (3 ways) • Write hand-tuned assembly versions of hot spots • Getting more done with every instruction • Using more than one processor ISA's, Compilers, and Assembly
Performance Optimization • Until you are an expert, first write a working version of the program • Then, and only then, begin tuning, first collecting data, and iterate • Otherwise, you will likely optimize what doesn’t matter “We should forget about small efficiencies, say about 97% of the time: premature optimization is the root of all evil.” -- Sir Tony Hoare ISA's, Compilers, and Assembly
Building a benchmark • You need something to gauge your progress. • Should be representative of how the program will be used ISA's, Compilers, and Assembly
Instrumenting your program • We can do this by hand. Consider: test.c --> test2.c • Let’s us know where the program is spending its time. • But implementing it is tedious; consider instrumenting 130k lines of code ISA's, Compilers, and Assembly
Using tools to do instrumentation • Two GNU tools integrated into the GCC C compiler • Gprof: The GNU profiler • Compile with the -pg flag • This flag causes gcc to keep track of which pieces of source code correspond to which chunks of object code and links in a profiling signal handler. • Run as normal; program requests the operating system to periodically send it signals; the signal handler records what instruction was executing when the signal was received in a file called gmon.out • Display results using gprof command • Shows how much time is being spent in each function. • Shows the calling context (the path of function calls) to the hot spot. ISA's, Compilers, and Assembly
Example gprof output Each sample counts as 0.01 seconds. % cumulative self self total time seconds seconds calls s/call s/call name 81.89 4.16 4.16 37913758 0.00 0.00 cache_access 16.14 4.98 0.82 1 0.82 5.08 sim_main 1.38 5.05 0.07 6254582 0.00 0.00 update_way_list 0.59 5.08 0.03 1428644 0.00 0.00 dl1_access_fn 0.00 5.08 0.00 711226 0.00 0.00 dl2_access_fn 0.00 5.08 0.00 256830 0.00 0.00 yylex Over 80% of time spent in one function Provides calling context (main calls sim_main calls cache_access) of hot spot index % time self children called name 0.82 4.26 1/1 main [2] [1] 100.0 0.82 4.26 1 sim_main [1] 4.18 0.07 36418454/36484188 cache_access <cycle 1> [4] 0.00 0.01 10/10 sys_syscall [9] 0.00 0.00 2935/2967 mem_translate [16] 0.00 0.00 2794/2824 mem_newpage [18] ISA's, Compilers, and Assembly
Using tools for instrumentation (cont.) • Gprof didn’t give us information on where in the function we were spending time. (cache_access is a big function; still needle in haystack) • Gcov: the GNU coverage tool • Compile/link with the -fprofile-arcs -ftest-coverage options • Adds code during compilation to add counters to every control flow edge (much like our by hand instrumentation) to compute how frequently each block of code gets executed. • Run as normal • For each xyz.c file an xyz.gdna and xyz.gcno file are generated • Post-process with gcov xyz.c • Computes execution frequency of each line of code • Marks with ##### any lines not executed • Useful for making sure that you tested your whole program ISA's, Compilers, and Assembly
Example gcov output Code never executed 14282656: 540: if (cp->hsize) { #####: 541: int hindex = CACHE_HASH(cp, tag); -: 542: #####: 543: for (blk=cp->sets[set].hash[hindex]; -: 544: blk; -: 545: blk=blk->hash_next) -: 546: { #####: 547: if (blk->tag == tag && (blk->status & CACHE_BLK_VALID)) #####: 548: goto cache_hit; -: 549: } -: 550: } else { -: 551: /* linear search the way list */ 753030193: 552: for (blk=cp->sets[set].way_head; -: 553: blk; -: 554: blk=blk->way_next) { 751950759: 555: if (blk->tag == tag && (blk->status & CACHE_BLK_VALID)) 738747537: 556: goto cache_hit; -: 557: } -: 558: } Loop executed over 50 interations on average (751950759/14282656) ISA's, Compilers, and Assembly
Conclusion • The second step to making a fast program is finding out why it is slow • The first step is making a working program • Your intuition where it is slow is probably wrong • So don’t guess, collect data! • Many tools already exist for automatically instrumenting your code • Identify the “hot spots” in your code where time is being spent • Two example tools: • Gprof: periodically interrupts program • Gcov: inserts counters into code • We’ll see Vtune in section, which explains why the code is slow • If you’ve never tuned your program, there is probably “low hanging fruit” • Most of the time is spent in one or two functions • Try using better data structures (225) or algorithms (473) to speed these up ISA's, Compilers, and Assembly