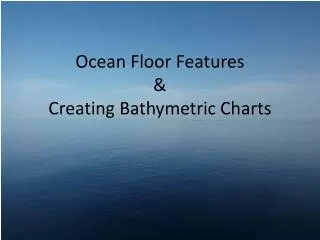
Ocean Floor Features & Creating Bathymetric Charts
220 likes | 553 Vues
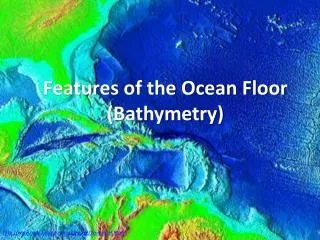
Ocean Floor Features & Creating Bathymetric Charts. Oceans cover 2/3 of the Earth ’ s surface. Arctic Ocean. Baltic Sea. Persian Gulf. Bay of Fundy. Atlantic Ocean. Pacific Ocean. Indian Ocean. Antarctic Ocean.

Ocean Floor Features & Creating Bathymetric Charts
E N D
Presentation Transcript
Oceans cover 2/3 of the Earth’s surface. Arctic Ocean Baltic Sea Persian Gulf Bay of Fundy Atlantic Ocean Pacific Ocean Indian Ocean Antarctic Ocean
Topography more varied with larger elevation changes than on the Earth’s continents.
Most Dramatic… Mid-oceanic ridges Trenches Island arcs Hot spots
How is the bathymetry determined? Sonar: measuring the time sound waves take to return to ship • Known facts: • travel time to bottom and back • Speed of sound in sea water The distance is determined by plugging these values into a simple formula
Geosat satellite • Launched in 1985 • Orbits the Earth in about 14 hours • The Earth rotates • Satellite map of the Earth’s topography, 1.5 years
Satellite altimetry • Dips and bumps are due to variations in gravitational force • Sea surface copies the ocean floor surface • Differences are measured using the time radar signals take to travel through the atmosphere, hit the ocean’s surface, and bounce back to the satellite For every increase of 1000 meters on the seafloor, there is 1 meter increase in height of water.
Bathymetry of Crater Lake • Depth from the surface • Lines of equal depth = contours • Contour Interval = every 100 ft • Tight contours = steep slopes • Wide contour spaces = flat
Creating your own Bathymetric Chart • Materials • Covered model • 2 Bamboo skewers • 2 rulers • 1 piece of graph paper per person • Colored pencils • Procedure • Mark N-S-E-W on the surface of the model and on your graph paper • Use your rulers to measure out a point-grid on the “sea-surface” and on your graph paper (3cm x 3cm is good) • Mark centimeters on the bamboo skewers with 0 at the pointed end • At the points you have chosen, poke the skewers through the blue paper (“sea-surface”) • Note the depth from the skewers and record these on the graph paper • Create a bathymetric chart by contouring the points. Use a countour interval of 1 cm.
6.4 4.0 5.8 8.8 6.1 6.7 8.4 1.2 2.5 2.6 3.1 2.4 7.3 7.1 1.9 2.1 6.3 5.3 6.2 8.5 4.9 6.5 7.9 3.0 3.5 4.2 2.8 7.5 7.0 0.8 2.6 1.4 6.2 1 7.1 7.5 9.3 6.4 6.8 8.8 4.8 5.4 6.3 4.5 6.7 8.2 3.1 1.8 7.1 7.2 7.5 9.5 7.3 7.2 9.1 1.5 5.2 6.0 6.9 4.1 7.4 8.3 2.4 3.7 7.4 6.6 6.9 0.7 9.2 7.5 7.8 8.6 4.6 5.3 5.9 3.4 7.2 8.0 1.7 2.7 7.1 5.9 6.3 9.6 7.8 8.2 9.2 3.8 4.3 5.2 3.1 6.7 8.7 2.4 0.5 1.2 7.7 6.9 7.5 9.1 7.9 8.1 8.9 4.7 5.8 6.4 4.0 7.6 8.5 1.1 2.4 3.5 6.2 6.6 7.4 9.3 6.3 7.4 8.5 4.6 5.3 5.9 3.7 6.1 8.0 1.3 2.6 3.7 5.5 7.3 6.1 10 5.6 6.6 8.8 5.1 5.7 6.2 4.6 5.2 7.6 2.1 3.9 0.9 4.1 6.0 10.2 9.3 4.9 5.2 6.5 4.9 5.6 6.8 4.4 3.9 8.1 2.5 1.2 4.1 4.8 5.9 9.8 9.1 5.3 5.5 6.8 4.9 5.4 6.4 4.5 4.5 8.2 1.9 0.8 3.7
6.4 4.0 5.8 8.8 6.1 6.7 8.4 1.2 2.5 2.6 3.1 2.4 7.3 7.1 1.9 2.1 6.3 5.3 6.2 8.5 4.9 6.5 7.9 3.0 3.5 4.2 2.8 7.5 7.0 0.8 2.6 1.4 6.2 1 7.1 7.5 9.3 6.4 6.8 8.8 4.8 5.4 6.3 4.5 6.7 8.2 3.1 1.8 7.1 7.2 7.5 9.5 7.3 7.2 9.1 1.5 5.2 6.0 6.9 4.1 7.4 8.3 2.4 3.7 7.4 6.6 6.9 0.7 9.2 7.5 7.8 8.6 4.6 5.3 5.9 3.4 7.2 8.0 1.7 2.7 7.1 5.9 6.3 9.6 7.8 8.2 9.2 3.8 4.3 5.2 3.1 6.7 8.7 2.4 0.5 1.2 7.7 6.9 7.5 9.1 7.9 8.1 8.9 4.7 5.8 6.4 4.0 7.6 8.5 1.1 2.4 3.5 6.2 6.6 7.4 9.3 6.3 7.4 8.5 4.6 5.3 5.9 3.7 6.1 8.0 1.3 2.6 3.7 5.5 7.3 6.1 10 5.6 6.6 8.8 5.1 5.7 6.2 4.6 5.2 7.6 2.1 3.9 0.9 4.1 6.0 10.2 9.3 4.9 5.2 6.5 4.9 5.6 6.8 4.4 3.9 8.1 2.5 1.2 4.1 4.8 5.9 9.8 9.1 5.3 5.5 6.8 4.9 5.4 6.4 4.5 4.5 8.2 1.9 0.8 3.7
Continental margins Atlantic Ocean: plate boundary is in the center of the ocean basin, away from the continental margin