Auditory Scene Analysis: Understanding Sound Segregation
Explore mechanisms of sound segregation, from bottom-up heuristic grouping to schema-based knowledge processing. Discover processes in segregating musical sounds and Bugandan xylophone music. Learn about sequential and simultaneous grouping cues, as well as streaming patterns in auditory perception.

Auditory Scene Analysis: Understanding Sound Segregation
E N D
Presentation Transcript
Auditory Scene Analysis Chris Darwin
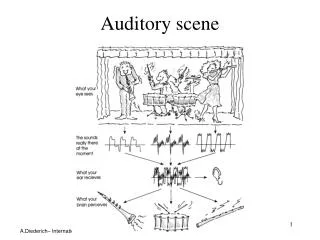
Need for sound segregation • Ears receive mixture of sounds • We hear each sound source as having its own appropriate timbre, pitch, location • Stored information about sounds (eg acoustic/phonetic relations) probably concerns a single source • Need to make single source properties (eg silence) explicit
Mechanisms of segregation • Primitive grouping mechanisms based on general heuristics such as harmonicity and onset-time - “bottom-up” / “pure audition” • Schema-based mechanisms based on specific knowledge (general speech constraints?) - “top-down.
Segregation of simple musical sounds • Successive segregation • Different frequency (or pitch) • Different spatial position • Different timbre • Simultaneous segregation • Different onset-time • Irregular spacing in frequency • Location (rather unreliable) • Uncorrelated FM not used
Successive grouping by frequency Bugandan xylophone music: “Ssematimba ne Kikwabanga” Track 7 Track 8
Not peripheral channelling Streaming occurs for sounds • with same auditory excitation pattern, but different periodicities Vliegen, J. and Oxenham, A. J. (1999). "Sequential stream segregation in the absence of spectral cues," J. Acoust. Soc. Am. 105, 339-46. • with Huggins pitch sounds that are only defined binaurally Akeroyd, Carlyon & Deeks (2005) JASA, 118, 977-81
"a faint tone" Noise Frequency Time 2π Interaural phase difference 0 500 Hz Frequency Huggins pitch ∆ø
Successive grouping by timbre Wessell illusion fo
Sach & Bailey - rhythm unmasking by ITD or spatial position ? Masker Target • ITD=0, ILD = 0 Target • ITD=0, ILD = +4 dB ITD sufficient but, sequential segregation by spatial position rather than by ITD alone.
Simultaneous: Frequency vs Space Tchaikovsky: Intro to 4th movement of Pathétique Symphony Left Right Frequency wins ! From Diana Deutsch (1999)
Build-up of segregation Horse Morse -LHL-LHL-LHL- --> --H---H---H-- -L-L-L-L-L-L-L • Segregation takes a few seconds to build up. • Then between-stream temporal / rhythmic judgments are very difficult
Some interesting points: • Sequential streaming may require attention - rather than being a pre-attentive process.
Attention necessary for build-up of streaming (Carlyon et al, JEP:HPP 2000) Horse Morse -LHL-LHL-LHL- --> --H---H---H-- -L-L-L-L-L-L-L • Horse -> Morse takes a few seconds to segregate • These have to be seconds spent attending to the tone stream • Does this also apply to other types of segregation?
Continuity and streaming Discontinuous frequency changes produce more streaming than do continuous changes
Capturing a component from a mixture by frequency proximity A-B A-BC Disjoint Allocation? Freq separation of AB Harmonicity & synchrony of BC Bregman & Pinker, 1978, Canad J Psychol
Rhythmic masking release Simultaneous onset prevents a component from forming part of a sequential stream Track 22
Simultaneous grouping • What is the timbre / pitch / location of a particular sound source ? • Important grouping cues • continuity (or repetition) “Old + New” • onset time • harmonicity (or regularity of frequency spacing)
Bregman’s Old + New principle • Stimulus: A followed by A+B • -> Percept of: • A as continuous (or repeated) • with B added as separate percept
A A A A M M M M M M M M M B B B B Old+New Heuristic A MAMB B MAMB
Percept M
Rate of onset and continuity Rapid increases in level lead to Old+New Gradual just heard as increase. Track 32
Grouping & vowel quality frequency time
Grouping & vowel quality (2) continuation not removed from vowel continuation removed from vowel captor frequency frequency time time frequency frequency time time + + frequency frequency time time
Onset-time:allocation is subtractive not exclusive • Bregman’s Old-plus-New heuristic • Indicates importance of coding change.
490 480 470 460 450 440 0 80 160 240 320 Asynchrony & vowel quality 8 subjects No 500 Hz component F1 boundary (Hz) T 90 ms Onset Asynchrony T (ms)
1 vowel 0.8 complex 0.6 0.4 0.2 0 -0.2 0 1 2 3 5 8 Mistuning & pitch Mean pitch shift (Hz) 90 ms 8 subjects % Mistuning of 4th Harmonic
Onset asynchrony & pitch 1 vowel 0.8 complex 0.6 0.4 0.2 0 -0.2 0 80 160 240 320 ±3% mistuning 8 subjects Mean pitch shift (Hz) T 90 ms Onset Asynchrony T (ms)
Some interesting points: • Sequential streaming may require attention - rather than being a pre-attentive process. • Parametric behaviour of grouping depends on what it is for.
Grouping for Effectiveness of a parameter on grouping depends on the task. Eg 10-ms onset time allows a harmonic to be heard out 40-ms onset-time needed to remove from vowel quality >100-ms needed to remove it from pitch.
c. 10 ms Harmonic in vowel to be heard out: 40 ms Harmonic to be removed from vowel: 200 ms Harmonic to be removed from pitch: Minimum onset needed for:
Grouping not absolute and independentof classification classify group
Apparent continuity If B would have masked if it HAD been there, then you don’t notice that it is not there. iTunes Track 28 - 31
Enharmonic Harmonic Continuity & grouping 1. Pulsing complex Pulsing high tone Steady low tone Group tones; then decide on continuity.
Some interesting points: • Sequential streaming may require attention - rather than being a pre-attentive process. • Parametric behaviour of grouping depends on what it is for. • Not everything that is obvious on an auditory spectrogram can be used : • FM of Fo irrelevant for segregation (Carlyon, JASA 1991; Summerfield & Culling 1992)
Masking sentence = 140 Hz ± 0,1,2,5,10 semitones Target sentence Fo = 140 Hz DFo between two sentences(Bird & Darwin 1998; after Brokx & Nooteboom, 1982) • Two sentences (same talker) • only voiced consonants • (with very few stops) • Thus maximising Fo effect Task: write down target sentence Replicates & extends Brokx & Nooteboom
Harm Inharmonic 2500 2000 1500 Easy 2500 2100 1500 Impossible frequency 1 2 3 Carlyon: across-frequency FM coherence 5 Hz, 2.5% FM Odd-one in 2 or 3 ? Carlyon, R. P. (1991). "Discriminating between coherent and incoherent frequency modulation of complex tones," J. Acoust. Soc. Am. 89, 329-340.
McAdams FM in sung vowels Bregman demo 24
Role of localisation cues What role do localisation cues play in helping us to hear one voice in the presence of another ? • Head shadow increases S/N at the nearer ear (Bronkhurst & Plomp, 1988). • … but this advantage is reduced if high frequencies inaudible (B & P, 1989) • But do localisation cues also contribute to selectively grouping different sound sources?
Some interesting points: • Sequential streaming may require attention - rather than being a pre-attentive process. • Parametric behaviour of grouping depends on what it is for. • Not everything that is obvious on an auditory spectrogram can be used : • FM of Fo irrelevant for segregation (Carlyon, JASA 1991; Summerfield & Culling 1992) • Although we can group sounds by ear, ITDs by themselves remarkably useless for simultaneous grouping. Group first then localise grouped object.
Separating two simultaneous sound sources • Noise bands played to different ears group by ear, but... • Noise bands differing in ITD do not group by ear
EE AR ear ITD AR EE AR EE delay ER OO Segregation by ear but not by ITD(Culling & Summerfield 1995) Task - what vowel is on your left ? (“ee”)
Phase Ambiguity 500 Hz: period = 2ms 500-Hz pure tone leading in Right ear by 1.5 ms Heard on Left side R leads by 1.5 ms L leads by 0.5 ms L R L cross-correlation peaks at +0.5ms and -1.5ms auditory system weighted toone closest to zero
Disambiguating phase-ambiguity • Narrowband noise at 500 Hz with ITD of 1.5 ms (3/4 cycle) heard at lagging side. • Increasing noise bandwidth changes location to the leading side. • Explained by across-frequency consistency of ITD. • (Jeffress, Trahiotis & Stern)
Cross-correlation peaks for noise delayed in one ear by 1.5 ms Resolving phase ambiguity Left ear actually lags by 1.5 ms 500 Hz: period = 2ms 300 Hz: period = 3.3ms L R R L R R L lags by 1.5 ms or L leads by 0.5 ms ? L lags by 1.5 ms or L leads by 1.8 ms ? 800 Actual delay 600 Frequency of auditory filter Hz 400 200 -2.5 -0.5 1.5 3.5 Delay of cross-correlator ms
Segregation by onset-time Synchronous Asynchronous 800 600 Frequency (Hz) 400 200 0 400 0 80 400 Duration (ms) Duration (ms) ITD: ± 1.5 ms (3/4 cycle at 500 Hz)
Segregated tone changes location 20 0 Pointer IID (dB) R L Complex Pure -20 0 20 40 80 Onset Asynchrony (ms)
Segregation by mistuning In tune Mistuned 800 600 Frequency (Hz) 400 200 0 400 0 80 400 Duration (ms) Duration (ms)