Download
1 / 40
430 likes | 593 Vues
Learn about Integrated Assessment Modeling and its roles in climate change research, interactions with the Climate Modeling Community, future challenges, technology pathways, emissions mitigation, and more. Understand how IAMs provide decision support tools for managing risk. Explore the interface with the Global Energy System and major challenges ahead. Stay updated on the IAM and CMC community interactions and the upcoming assessment phases. Discover how IAMs are organized and the evolution of Representative Concentration Pathways.

E N D
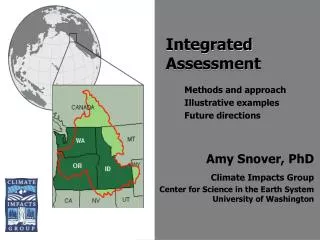
INTEGRATED ASSESSMENT MODELING 13th Annual CCSM Workshop The Village at Breckenridge, Breckenridge, Colorado Jae Edmonds and Steve Smith June 18, 2008
OVERVIEW • What is Integrated Assessment Modeling (IAM)? • How is the IAM community interacting with the Climate Modeling Community (CMC)? • What does the future hold for IAMs?
Integrated assessment modeling describes the interactions between human and natural earth systems IAMs conduct human systems research, historically focused on the energy-emissions interface. IAMs integrate human and natural Earth systems. The future challenge is to extend IAMs ability to describe climate impacts and adaptations.
Integrated Assessment Modeling Has Four Roles In Climate Change Research IAMs historical role has been to provide data and models, grounded in human systems research, relevant to understanding the scale and timing of the drivers of climate change over decades to century time scales. (A major interface with the climate modeling community CMC.)
Integrated Assessment Modeling Has Three Roles In Climate Change Research Energy, the Economy, Terrestrial Carbon Cycle, Agriculture, Land use, & Land Cover IAMs have also combine knowledge derived from multiple fields of climate research—human and natural Earthsystems—in a way that can provide insights that would otherwise be unavailable from the pursuit of focused disciplinary research.
Land Use Change Emissions and Crop Productivity • Cumulative Emissions 2005 to 2095 • 0.5%/yr crop productivity growth: • 5.2 PgC • No crop productivity growth: • 169 PgC
Corn Price When Carbon Is Valued But No Bioenergy Is Produced • Significant crop price escalation occurs if carbon is valued, even in the absence of purpose grown bioenergy production. • Prior to 2040 the influence of bioenergy is negligible. • Prior to 2040 crop price escalation, relative to the reference scenario, is predominantly driven by the value of carbon.
Integrated Assessment Modeling IAMs provide decision makers in both the public and private sectors, e.g. the CCTP, with science-based decision support tools to help them manage risk.
The Global Energy SystemFour Evolutionary Technology Pathways Ref–500 ppmv Adv–500 ppmv RNE–500 ppmv BioCCS–500 ppmv
International Participation in Emissions Mitigation Year 2020 Annex I emissions mitigation, relative to 2005, for different accession assumptions: 450 ppm Not Possible Not Possible 2020 2050
Major Future Challenges for IAMs(After Janetos) • One of the major challenges for IAMs in the coming decade: Land Use, Land Cover, Water, Ecosystems, Terrestrial Carbon Cycle, and the Interface with the Global Energy System Including Bioenergy • IPCC WG2 in the AR4 used land to adapt to climate change. • IPCC WG3 in the AR4 assumed that land would be available to mitigate emissions producing bioenergy. • But also (emphasized in Summer 2007 DOE workshops) • Ocean acidification • Coastal systems and sea level • Extreme events • Energy and transport • Health and demographics
HOW IS THE IAM COMMUNITY INTERACTING WITH THE CLIMATE MODELING (CMC) COMMUNITY?
A “Parallel Approach” Implies Much More Interaction Between the IAM and CMC
Work Plan for an Anticipated Major Assessment in the 2013-14 Time FrameFOUR PHASES • The Preparatory PhaseandRepresentative Concentration Pathways (RCPs) • Parallel Phase:Prepare climate and socio-economic scenarios in parallel • Integration Phase: • “Pair up” climate scenarios with new socio-economic scenarios; and scaling for IAV research; • IAV-IAM “teaming to more fully integrate representation of impacts in IAMs and IAV research. • Publication Phase AR5 WG II & III Reports AR5 WG I Report 2014 2013
Scenarios by Whom? For the first time scenarios are being organized by the modeling community and NOT the IPCC. • The IAM community has organized itself via the IAMC. • The CM community has organized it self via the WCRP/IGBP.
PRODUCT 1Representative Concentration Pathways From the Existing Literature, Already Underway RCP8.5 • >8.5 W/m2 in 2100, • Rising RCP6 • ~6 W/m2 at stabilization after 2100 • Stabilization without exceeding target RCP4.5 • ~4.5 W/m2 at stabilization after 2100 • Stabilization without exceeding target RCP3-PD • <3 W/m2 in 2100 • peak & decline stabilization RCPs Selection, Extension to 2300, Downscaling CMC Develops RCP-based Ensemble Runs 12 months 12 month 18 months Integration Phase Publication Lag Fall 2008 Fall 2007 Fall 2010 Spring 2012 Spring 2013 Preparatory Phase
Representative Concentration Pathways (RCPs) FORCING AGENTS GHG Emissions and Concentrations from IAMs • Greenhouse gases: CO2, CH4, N2O, CFCs, HFC’s, PFC’s, SF6 • Emissions of chemically active gases: CO, NOx, NH4, VOCs • Derived GHG’s: tropospheric O3 • Emissions of aerosols: SO2, BC, OC • Land use and land cover [NEW] EXTENSIONS Downscaling of SHORT LIVED SPECIES and LAND USE/LAND COVER to appropriate geographic resolution, perhaps as fine as ½o x ½o grid scale for both the near-term and long-term climate experiments. Extension of scenarios to 2300.
The RCP Scenarios CO2 Emissions and Total Radiative Forcing Graphs: Detlef van Vuuren
2.6 W/m2 or 2.9 W/m2? Which scenario for the low (<3W/m2) RCP? Noordwijkerhout debate over what it means to be: “compatible with the full range of stabilization, mitigation, and baseline emissions scenarios available in the current literature” Van Vuuren et al. published a 2.9 W/m2and explored the potential of bioenergy with CCS to reduce 2100 radiative forcing to still lower levels. • The authors emphasized the experimental nature of the 2.6 W/m2 scenario and indicated that they were uncomfortable with providing it as an RCP absent further review on their part. • Some members of the policy user community argued strongly that 2.6 W/m2 was absolutely essential. The IAMC is conducting a process to review the robustness of a revised 2.6 W/m2 scenario.
RCP “Handoff” • There is a “Handshake” document. • Work plan for data exchange between the Integrated Assessment and Climate Modeling community in support of Phase-0 of scenario analysis for climate change assessment (Representative Community Pathways).
RCP “Handoff” The four IAM teams who have agreed to supply RCP scenarios are currently preparing scenario data, to be delivered in September 2008. • IAM teams are updating historical data and producing additional information requested by Earth System Models (ESM), particularly regarding land-use. • A draft “handshake” protocol has been developed detailing the data to be delivered to the earth-system modeling community • The development of a consensus set of base year 2000 emissions and historical emissions from at least 1850 forward. • IAM, emissions inventory, and chemical modeling communities • Goal: Seamless transition between history and future scenario
RCP “Handoff” The IAM data will be used by chemistry models to produce future scenarios for atmospheric chemistry (oxidants, ozone, and, in some cases, aerosols) in preparation for ESM model runs starting in early 2009.
Future and Historical Emissions A goal of the RCP development process is to produce a consistent estimate of historical emissions along with four future RCP projections that start from a common year 2000 data set. A similar process is taking place for land-use and land-use change
RCP Sectoral Detail The RCP emissions data will be provided in greater sectoral detail than for previous scenario exercises: • Ground Transportation • International Shipping • Aviation • Power Plants, Energy Conversion, Extraction, and Distribution • Solvents • Waste (landfills, wastewater, non-energy incineration) • Industry (combustion & processing) • Residential and Commercial • Ag waste burning on Fields • Agriculture (e.g. Animals, Rice, & Soil) • Savannah Burning • Land-Use Change (Deforestation) Greater detail is due to spatial, chemical, temporal, and differing sectoral coverage within ESM models
RCP Land-Use Land-use and land-use change data will also be provided on a gridded basis: • Cropland • Harvested forest area (secondary forests) • Deforested area (primary forests) • Pasture and grazing land • Urban land Supplementary data that has also been requested includes: • Irrigated area • Timber and wood harvest amounts (and disposition) • Standard of living indicator • Fertilizer use
RCP Land-Use Spatially distributed information will be a fundamental part of new scenarios. Forest Cover
RCP Extension to 2300 Emissions and land-use for the RCP scenarios will be extended to 2300 to allow for long-term climate simulations. • Emissions (RCP 2.9/2.6 and 8.5) or concentrations (RCP 4.5 & 6) past 2100 will be held constant (consistent with forcing stabilization in 4.5 and 6 scenarios). • Cropland and pasture areas past 2100 will be scaled with global population. The extension procedure is very simple, and is intended to produce a consistent data set for ESM modeling. These are not full 300-year scenarios!
PRODUCT 2Ensemble Climate Change Scenarios RCPs Selection, Extension to 2300, Downscaling • Time to produce: <24 months • Product: Ensembles of gridded, time dependent projections of climate change produced by multiple climate models for the four long-term RCPs and • High resolution, near-term projections to 2030 (4.5W/m2 stabilization only). • Long-term scenarios extended to the year 2300. CMC Develops RCP-based Ensemble Runs Long-term Reference Stabilization Technology Policy Regional Ensembles Reference Stabilization Technology Policy Regional Near-term 12 months 12 month 24 months 18 months Parallel Phase Integration Phase Publication Lag Fall 2008 Fall 2007 Fall 2010 Spring 2012 Spring 2013 Preparatory Phase
PRODUCT 3New IAM Scenario Pathways • Time to produce: 24 months • Product: Groups of new scenario pathways developed by the IAM research community exploring a wide range of dimensions associated with anthropogenic climate forcing. • Anticipated outputs include • alternative socio-economic backgrounds, • alternative technology availability regimes, • alternative realizations of Earth system science research, • alternative stabilization scenario pathways including traditional, “not-to-exceed” scenario pathways, • “overshoot” scenario pathways, and • alternative representations of regionally heterogeneous mitigation policies and measures, as well as regional societies, economies and policies. RCPs Selection, Extension to 2300, Downscaling Development of New IAM Scenarios Reference Stabilization Technology Policy Regional Long-term CMC Develops RCP- based Ensemble Runs Reference Stabilization Technology Policy Regional Ensembles Reference Stabilization Technology Policy Regional Short-term 12 months 18 months 12 month 24 months Integration Phase Parallel Phase Publication Lag Fall 2008 Fall 2007 Fall 2010 Spring 2012 Spring 2013
Time to produce: 24 months Product: Detailed descriptions to be associated with the four RCPs produced in the Preparatory Phase and such pathways developed as part of Product 3 as selected by IAM and IAV communities. PRODUCT 4Global Narrative Storylines RCPs Selection, Extension to 2300, Downscaling Development of New IAM Scenarios CMC Develops RCP- based Ensemble Runs IAM CMC IAV Story Lines IAV Research Based on AR4 Climate and SRES IAM scenarios AR5 WG II & III Reports AR5 WG I Report 2014 2013 12 months 18 months 12 month 24 months Integration Phase Parallel Phase Publication Lag Fall 2008 Fall 2007 Fall 2010 Spring 2012 Spring 2013
IAMs Combine New Scenarios With New CMC Ensembles IAM CMC IAV AR5 WG II & III Reports AR5 WG I Report 2014 2013
IAV Research Community Combine New Scenarios With New CMC Ensembles IAM CMC IAV
WHAT DOES THE FUTURE HOLD FOR INTEGRATED ASSESSMENT MODELING AND ESMS?
Future Challenges for IAMs • Increased geographic specificity—for both land use and emissions of short-lived species. Shorter time steps. Longer time horizons—2300. Closer interface with the CMC.
Two Parallel Development Directions • IAM in future ESMs. • ESMs are incorporating ever more Earth system processes. • Overlap with IAMs which produce land use and land cover and emissions of greenhouse gases and short-lived species. • Obvious benefit to ESMs to incorporating the human and terrestrial systems components of IAMs. • This will require close collaboration because just as great mischief is possible when social scientists try to run ESMs, similarly great mischief is possible when natural scientists try to run the human system components of IAMs.
Two Parallel Development Directions • IAM as the home of human systemsresearch and EMICs for rapid exploration of the systems implication of new science. • Noordwijkerhout-Snowmass-Aspen “parallel approach” to faster development of scenario-ensembles for use by the IAV community. • Importance of improved science. • A tool for understanding the Earth system implications of climate change for human and natural systems—impacts and adaptation. • A tool for understanding the implications of emissions mitigation on climate and climate on emissions mitigation, including the potential role of transformational science and technology.
In the Decade Ahead Early 1980s Early 1990s Late 1990s Present Day Fully closed systems Coastal zones Sea level and Ice Ocean acidification A major feature of future work will be an increased emphasis on climate impacts on and adaptation by energy and other human and natural systems. Local air quality Energy impacts Fresh Water Systems Hydrology Ecosystem impacts Ag-land-use Ag-land-use Terr. carbon cycle Terr. carbon cycle Non-sulfur aerosol Non-sulfur aerosol Sulfur aerosol Sulfur aerosol Sulfur aerosol Energy technology Energy technology Energy technology Atmos. Chem. Atmos. Chem. Atmos. Chem. Atmos. Chem. Climate model Climate model Climate model Climate model Ocean carbon cycle Ocean carbon cycle Ocean carbon cycle Ocean carbon cycle Energy-economy Energy-economy Energy-economy Energy-economy Energy-economy
In the Decade Ahead Early 1980s Early 1990s Late 1990s Present Day Fully closed systems Coastal zones Sea level and Ice Ocean acidification …while integrating with a deeper understanding of energy, technology, and economy including finer spatial resolution, longer time horizons, and closer coupling to ESMs. Local air quality Energy impacts Fresh Water Systems Hydrology Ecosystem impacts Ag-land-use Ag-land-use Terr. carbon cycle Terr. carbon cycle Non-sulfur aerosol Non-sulfur aerosol Sulfur aerosol Sulfur aerosol Sulfur aerosol Energy technology Energy technology Energy technology Atmos. Chem. Atmos. Chem. Atmos. Chem. Atmos. Chem. Climate model Climate model Climate model Climate model Ocean carbon cycle Ocean carbon cycle Ocean carbon cycle Ocean carbon cycle Energy-economy Energy-economy Energy-economy Energy-economy Energy-economy