Sensation and Perception: Key Concepts and Applications
Explore the intricate processes of sensation and perception, from sensory experiences to mental representations. Learn about thresholds, signal detection theory, discriminability, bias, and the essential role of neural codes. This comprehensive guide delves into top-down and bottom-up processes, providing insights into how we interpret and navigate our environment. Discover the significance of subliminal stimuli, discriminability measures, and the interplay between stimulus and perceiver in shaping our perceptions.

Sensation and Perception: Key Concepts and Applications
E N D
Presentation Transcript
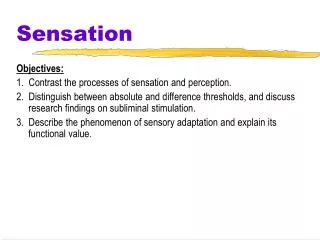
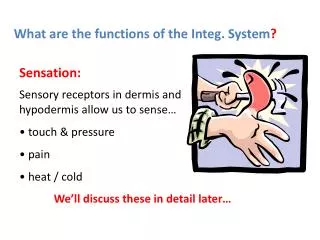
Sensation • Perception = gathering information from the environment • 2 stages: • Sensation = simple sensory experiences and translating physical energy from the environment into neural codes • Perception = organizing, identifying, and interpreting sensations to create mental representations of objects and events
Top-down and Bottom-up Processes in Perception • Bottom-up • “data driven” • “stimulus driven” • Example: different wavelengths of light produce different color sensations • Top-down • “conceptually driven” • “context driven” • Example: reading an exit sign more quickly because you know what it is likely to be
Topics in Sensation • Thresholds • Signal Detection Theory • Sensory Memory
Thresholds • Absolute threshold – the lowest intensity of a stimulus that can be detected • Subliminal stimuli • “Eat Popcorn” (McConnell et al 1958) • Backward messages • Self-help tapes (Greenwald et al 1991) • Priming • So do subliminal stimuli have real effects?
Thresholds: Theoretical and Actual Functions • Theoretical Threshold Functions (Step Threshold) • Actual Threshold Functions (Threshold is a continuous function) • Operational Definition of the Absolute Threshold • The stimulus intensity at which it is correctly identified 50% of the time • Is there anything else besides stimulus intensity that must be considered?
Signal Detection Theory • 2 Components of detection judgments • Discriminability • How much sensory evidence is there that a signal is present? • Controlled by stimulus • Bottom-up • Bias • How much evidence does the perceiver require before saying “yes”? • Controlled by a “pay-off matrix” (among other things) • Top-down
Separating Discriminability From Bias: 4 types of responses Stimulus Present Absent Response Yes No
Person A:Threshold with a Conservative Bias Loudness = 10 decibels Stimulus Present Absent Response Yes No
Person B:Threshold with a Liberal Bias Loudness = 10 decibels Stimulus Present Absent Response Yes No
Person C:Threshold with a Liberal Bias Loudness = 5 decibels Stimulus Present Absent Response Yes No
Class Data from Coglab*:Positive (Liberal) Bias Condition Stimulus Present Absent Response Yes No
Class Data from Coglab*:Negative (Conservative) Bias Condition Stimulus Present Absent Response Yes No
Discriminability and Bias • Signal and Noise distributions • X axis: Magnitude of internal sensory process (amount of neural excitation) • Y axis: frequency (probability density function) • Noise: effects of noise alone • Signal: effects of signal plus noise • Criterion • How much neural excitation does the perceiver require before saying “yes”? • Tutorial: http://psych.hanover.edu/Krantz/STD/
Signal Detection Measures of Discriminability and Bias • Discriminability • d’ (d prime) • distance between signal and noise distributions • 0 = no discriminability; higher values = more • Assumes that the signal and noise distributions are normal • Log(alpha) • another measure of discriminability that does not assume normality • 0 = no discriminability; 4.6 = perfect performance
Signal Detection Measures of Discriminability and Bias • Bias • Beta • 1 = neutral (when the criterion is through the point where the signal and noise distributions cross) • < 1 = liberal (“yes”) bias • > 1 = conservative (“no”) bias • C • 0 = neutral • < 0 = liberal • > 0 = conservative
Class Coglab Data Results1 (from a previous class. Your data are HERE) Hits False Alarms d prime Log-alpha C (bias)
Evidence for Signal Detection Theory • Swets, Tannar, & Birdsall, 1961 • 4 choice detection task (tones A, B, C, D) • After an incorrect answer, answered again • If the participants had no information about which tone it was when they were wrong, should be at chance on subsequent guesses • Results: after a missed guess, they were above chance on the next guess • Therefore, the threshold is a continuous function (as Signal Detection Theory predicts), not a step function.
The Problem of Bias • How can researchers avoid mistakenly attributing changes in response bias to perceptual effects (discrimination)? • Use Signal Detection Theory measures of discriminability and bias to distinguish the two • Induce a strong conservative bias • Use a forced-choice task
Importance of SDT • Stimulus detection is a function of not only how strong the signal is, but also the criterion that the perceiver chooses • Even basic sensory processes involve both bottom-up and top-down processes • Perception depends on contributions from both the stimulus and the perceiver • Sub-threshold stimuli can still provide information (and thus influence cognitive processes)
Sensory Storage • Sensory information is briefly stored at a low (relatively unprocessed) level • Icon – brief storage of visual information • Echo – brief storage of auditory information