Download
1 / 57
570 likes | 729 Vues
Chapter 3 Properties of Pure Substances Study Guide in PowerPoint to accompany Thermodynamics: An Engineering Approach , 7th edition by Yunus A. Çengel and Michael A. Boles. We now turn our attention to the concept of pure substances and the presentation of their data. Simple System

E N D
Chapter 3 Properties of Pure SubstancesStudy Guide in PowerPointto accompanyThermodynamics: An Engineering Approach, 7th editionby Yunus A. Çengel and Michael A. Boles
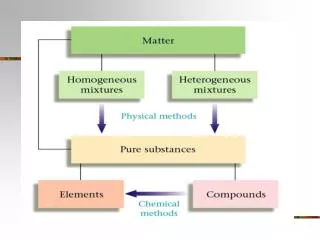
We now turn our attention to the concept of pure substances and the presentation of their data. Simple System A simple system is one in which the effects of motion, viscosity, fluid shear, capillarity, anisotropic stress, and external force fields are absent. Homogeneous Substance A substance that has uniform thermodynamic properties throughout is said to be homogeneous. Pure Substance A pure substance has a homogeneous and invariable chemical composition and may exist in more than one phase. Examples: 1. Water (solid, liquid, and vapor phases) 2. Mixture of liquid water and water vapor 3. Carbon dioxide, CO2 4. Nitrogen, N2 5. Mixtures of gases, such as air, as long as there is no change of phase.
For more information and animations illustrating this topic visit the Animation Library developed by Professor S. Bhattacharjee, San Diego State University, at this link. test.sdsu.edu/testhome/vtAnimations/index.html State Postulate Again, the state postulate for a simple, pure substance states that the equilibrium state can be determined by specifying any two independent intensive properties. The P-V-T Surface for a Real Substance • P-V-T Surface for a Substance that contracts upon freezing
P-V-T Surface for a Substance that expands upon freezing Real substances that readily change phase from solid to liquid to gas such as water, refrigerant-134a, and ammonia cannot be treated as ideal gases in general. The pressure, volume, temperature relation, or equation of state for these substances is generally very complicated, and the thermodynamic properties are given in table form. The properties of these substances may be illustrated by the functional relation F(P,v,T)=0, called an equation of state. The above two figures illustrate the function for a substance that contracts on freezing and a substance that expands on freezing. Constant pressure curves on a temperature-volume diagram are shown in Figure 3-11.
These figures show three regions where a substance like water may exist as a solid, liquid or gas (or vapor). Also these figures show that a substance may exist as a mixture of two phases during phase change, solid-vapor, solid-liquid, and liquid-vapor. Water may exist in the compressed liquid region, a region where saturated liquid water and saturated water vapor are in equilibrium (called the saturation region), and the superheated vapor region (the solid or ice region is not shown). Let's consider the results of heating liquid water from 20C, 1 atm while keeping the pressure constant. We will follow the constant pressure process shown in Figure 3-11. First place liquid water in a piston-cylinder device where a fixed weight is placed on the piston to keep the pressure of the water constant at all times. As liquid water is heated while the pressure is held constant, the following events occur. Process 1-2: The temperature and specific volume will increase from the compressed liquid, or subcooled liquid, state 1, to the saturated liquid state 2. In the compressed liquid region, the properties of the liquid are approximately equal to the properties of the saturated liquid state at the temperature.
Process 2-3: At state 2 the liquid has reached the temperature at which it begins to boil, called the saturation temperature, and is said to exist as a saturated liquid. Properties at the saturated liquid state are noted by the subscript f and v2 = vf. During the phase change both the temperature and pressure remain constant (according to the International Temperature Scale of 1990, ITS-90, water boils at 99.975C 100C when the pressure is 1 atm or 101.325 kPa). At state 3 the liquid and vapor phase are in equilibrium and any point on the line between states 2 and 3 has the same temperature and pressure.
Process 3-4: At state 4 a saturated vapor exists and vaporization is complete. The subscript g will always denote a saturated vapor state. Note v4 = vg. Thermodynamic properties at the saturated liquid state and saturated vapor state are given in Table A-4 as the saturated temperature table and Table A-5 as the saturated pressure table. These tables contain the same information. In Table A-4 the saturation temperature is the independent property, and in Table A-5 the saturation pressure is the independent property. The saturation pressure is the pressure at which phase change will occur for a given temperature. In the saturation region the temperature and pressure are dependent properties; if one is known, then the other is automatically known.
Process 4-5: If the constant pressure heating is continued, the temperature will begin to increase above the saturation temperature, 100 C in this example, and the volume also increases. State 5 is called a superheated state because T5 is greater than the saturation temperature for the pressure and the vapor is not about to condense. Thermodynamic properties for water in the superheated region are found in the superheated steam tables, Table A-6. This constant pressure heating process is illustrated in the following figure.
99.975 Figure 3-11 Consider repeating this process for other constant pressure lines as shown below.
373.95 If all of the saturated liquid states are connected, the saturated liquid line is established. If all of the saturated vapor states are connected, the saturated vapor line is established. These two lines intersect at the critical point and form what is often called the “steam dome.” The region between the saturated liquid line and the saturated vapor line is called by these terms: saturated liquid-vapor mixture region, wet region (i.e., a mixture of saturated liquid and saturated vapor), two-phase region, and just the saturation region. Notice that the trend of the temperature following a constant pressure line is to increase with increasing volume and the trend of the pressure following a constant temperature line is to decrease with increasing volume.
179.88oC 99.61oC P2 = 1000 kPa P1 = 100 kPa
The region to the left of the saturated liquid line and below the critical temperature is called the compressed liquid region. The region to the right of the saturated vapor line and above the critical temperature is called the superheated region. See Table A-1 for the critical point data for selected substances. Review the P-v diagrams for substances that contract on freezing and those that expand on freezing given in Figure 3-21 and Figure 3-22. At temperatures and pressures above the critical point, the phase transition from liquid to vapor is no longer discrete.
Figure 3-25 shows the P-T diagram, often called the phase diagram, for pure substances that contract and expand upon freezing. The triple point of water is 0.01oC, 0.6117 kPa (See Table 3-3). The critical point of water is 373.95oC, 22.064 MPa (See Table A-1).
Plot the following processes on the P-T diagram for water (expands on freezing) and give examples of these processes from your personal experiences. 1. process a-b: liquid to vapor transition 2. process c-d: solid to liquid transition 3. process e-f: solid to vapor transition
Property Tables In addition to the temperature, pressure, and volume data, Tables A-4 through A-8 contain the data for the specific internal energy u the specific enthalpy h and the specific entropy s. The enthalpy is a convenient grouping of the internal energy, pressure, and volume and is given by The enthalpy per unit mass is We will find that the enthalpy h is quite useful in calculating the energy of mass streams flowing into and out of control volumes. The enthalpy is also useful in the energy balance during a constant pressure process for a substance contained in a closed piston-cylinder device. The enthalpy has units of energy per unit mass, kJ/kg. The entropy s is a property defined by the second law of thermodynamics and is related to the heat transfer to a system divided by the system temperature; thus, the entropy has units of energy divided by temperature. The concept of entropy is explained in Chapters 6 and 7.
Saturated Water Tables Since temperature and pressure are dependent properties using the phase change, two tables are given for the saturation region. Table A-4 has temperature as the independent property; Table A-5 has pressure as the independent property. These two tables contain the same information and often only one table is given. For the complete Table A-4, the last entry is the critical point at 373.95oC. TABLE A-4 Saturated water-Temperature table See next slide.
TABLE A-5 Saturated water-Pressure table
For the complete Table A-5, the last entry is the critical point at 22.064 MPa. Saturation pressure is the pressure at which the liquid and vapor phases are in equilibrium at a given temperature. Saturation temperature is the temperature at which the liquid and vapor phases are in equilibrium at a given pressure. In Figure 3-11, states 2, 3, and 4 are saturation states. The subscript fg used in Tables A-4 and A-5 refers to the difference between the saturated vapor value and the saturated liquid value region. That is, The quantity hfgis called the enthalpy of vaporization (or latent heat of vaporization). It represents the amount of energy needed to vaporize a unit of mass of saturated liquid at a given temperature or pressure. It decreases as the temperature or pressure increases, and becomes zero at the critical point.
Quality and Saturated Liquid-Vapor Mixture Now, let’s review the constant pressure heat addition process for water shown in Figure 3-11. Since state 3 is a mixture of saturated liquid and saturated vapor, how do we locate it on the T-v diagram? To establish the location of state 3 a new parameter called the quality x is defined as The quality is zero for the saturated liquid and one for the saturated vapor (0 ≤ x ≤ 1). The average specific volume at any state 3 is given in terms of the quality as follows. Consider a mixture of saturated liquid and saturated vapor. The liquid has a mass mf and occupies a volume Vf. The vapor has a mass mg and occupies a volume Vg.
We note Recall the definition of quality x Then Note, quantity 1- x is often given the name moisture. The specific volume of the saturated mixture becomes
The form that we use most often is It is noted that the value of any extensive property per unit mass in the saturation region is calculated from an equation having a form similar to that of the above equation. Let Y be any extensive property and let y be the corresponding intensive property, Y/m, then The term yfg is the difference between the saturated vapor and the saturated liquid values of the property y; y may be replaced by any of the variables v, u, h, or s. We often use the above equation to determine the quality x of a saturated liquid-vapor state. The following application is called the Lever Rule:
The Lever Rule is illustrated in the following figures. Superheated Water Table A substance is said to be superheated if the given temperature is greater than the saturation temperature for the given pressure. State 5 in Figure 3-11is a superheated state. In the superheated water Table A-6, T and P are the independent properties. The value of temperature to the right of the pressure is the saturation temperature for the pressure. The first entry in the table is the saturated vapor state at the pressure.
Compressed Liquid Water Table A substance is said to be a compressed liquid when the pressure is greater than the saturation pressure for the temperature. It is now noted that state 1 in Figure 3-11is called a compressed liquid state because the saturation pressure for the temperature T1 is less than P1. Data for water compressed liquid states are found in the compressed liquid tables, Table A-7. Table A-7 is arranged like Table A-6, except the saturation states are the saturated liquid states. Note that the data in Table A-7 begins at 5 MPa or 50 times atmospheric pressure.
At pressures below 5 MPa for water, the data are approximately equal to the saturated liquid data at the given temperature. We approximate intensive parameter y, that is v, u, h, and s data as The enthalpy is more sensitive to variations in pressure; therefore, at high pressures the enthalpy can be approximated by
For our work, the compressed liquid enthalpy may be approximated by Saturated Ice-Water Vapor Table When the temperature of a substance is below the triple point temperature, the saturated solid and liquid phases exist in equilibrium. Here we define the quality as the ratio of the mass that is vapor to the total mass of solid and vapor in the saturated solid-vapor mixture. The process of changing directly from the solid phase to the vapor phase is called sublimation. Data for saturated ice and water vapor are given in Table A-8. In Table A-8, the term Subl. refers to the difference between the saturated vapor value and the saturated solid value.
The specific volume, internal energy, enthalpy, and entropy for a mixture of saturated ice and saturated vapor are calculated similarly to that of saturated liquid-vapor mixtures. where the quality x of a saturated ice-vapor state is How to Choose the Right Table The correct table to use to find the thermodynamic properties of a real substance can always be determined by comparing the known state properties to the properties in the saturation region. Given the temperature or pressure and one other property from the group v, u, h, and s, the following procedure is used. For example if the pressure and specific volume are specified, three questions are asked. For the given pressure,
For the given pressure The answer to one of these questions must be yes. If the answer to the first question is yes, the state is in the compressed liquid region, and the compressed liquid tables are used to find the properties of the state. If the answer to the second question is yes, the state is in the saturation region, and either the saturation temperature table or the saturation pressure table is used to find the properties. Then the quality is calculated and is used to calculate the other properties, u, h, and s. If the answer to the third question is yes, the state is in the superheated region and the superheated tables are used to find the other properties. Some tables may not always give the internal energy. When it is not listed, the internal energy is calculated from the definition of the enthalpy as
Example 3-1 Find the internal energy of water at the given states for 7 MPa and plot the states on T-v, P-v, and P-T diagrams.
P Steam CP 7 MPa Triple Point 0.01 285.8 373.95 T C
1.P = 7 MPa, dry saturated or saturated vapor Using Table A-5, Locate state 1 on the T-v, P-v, and P-T diagrams. 2. P = 7 MPa, wet saturated or saturated liquid Using Table A-5, Locate state 2 on the T-v, P-v, and P-T diagrams. 3. Moisture = 5%, P = 7 MPa let moisture be y,defined as
then, the quality is and using Table A-5, Notice that we could have used Locate state 3 on the T-v, P-v, and P-T diagrams. 4. P = 7 MPa, T = 600C For P = 7 MPa, Table A-5 gives Tsat = 285.83C. Since 600C > Tsat for this pressure, the state is superheated. Use Table A-6.
Locate state 4 on the T-v, P-v, and P-T diagrams. 5. P = 7 MPa, T = 100C Using Table A-4, At T = 100C, Psat = 0.10142 MPa. Since P > Psat, the state is compressed liquid. Approximate solution: Solution using Table A-7: We do linear interpolation to get the value at 100C. (We will demonstrate how to do linear interpolation with this problem even though one could accurately estimate the answer.) P MPa u kJ/kg 5 417.65 7 u = ? 10 416.23
The interpolation scheme is called “the ratio of corresponding differences.” Using the above table, form the following ratios. Locate state 5 on the T-v, P-v, and P-T diagrams. 6. P = 7 MPa, T = 460C Since 460C > Tsat = 385.83C at P = 7 MPa, the state is superheated. Using Table A-6, we do a linear interpolation to calculate u. T C u kJ/kg 450 2979.0 460 u = ? 500 3074.3 Using the above table, form the following ratios.
Locate state 6 on the T-v, P-v, and P-T diagrams. Example 3-2 Determine the enthalpy of 1.5 kg of water contained in a volume of 1.2 m3 at 200 kPa. Recall we need two independent, intensive properties to specify the state of a simple substance. Pressure P is one intensive property and specific volume is another. Therefore, we calculate the specific volume. Using Table A-5 at P = 200 kPa,
T v vf= 0.001061 m3/kg , vg = 0.8858 m3/kg Now, Locate this state on a T-v diagram. We see that the state is in the two-phase or saturation region. So we must find the quality x first.
Then, Example 2-3 Determine the internal energy of refrigerant-134a at a temperature of 0C and a quality of 60%. Using Table A-11, for T = 0C, uf = 51.63 kJ/kg ug =230.16 kJ/kg
P v then, Example 2-4 Consider the closed, rigid container of water shown below. The pressure is 700 kPa, the mass of the saturated liquid is 1.78 kg, and the mass of the saturated vapor is 0.22 kg. Heat is added to the water until the pressure increases to 8 MPa. Find the final temperature, enthalpy, and internal energy of the water. Does the liquid level rise or fall? Plot this process on a P-v diagram with respect to the saturation lines and the critical point. mg, Vg Sat. Vapor mf, Vf Sat. Liquid
Let’s introduce a solution procedure that we will follow throughout the course. A similar solution technique is discussed in detail in Chapter 1. System: A closed system composed of the water enclosed in the tank Property Relation: Steam Tables Process: Volume is constant (rigid container) For the closed system the total mass is constant and since the process is one in which the volume is constant, the average specific volume of the saturated mixture during the process is given by or Now to find v1 recall that in the two-phase region at state 1
Then, at P = 700 kPa State 2 is specified by: P2 = 8 MPa, v2 = 0.031 m3/kg At 8 MPa = 8000 kPa, vf = 0.001384 m3/kg vg = 0.02352 m3/kg at 8 MPa, v2 = 0.031 m3/kg.
Therefore, State 2 is superheated. Interpolating in the superheated tables at 8 MPa, v = 0.031 m3/kg gives, T2 = 361 C h2 = 3024 kJ/kg u2 = 2776 kJ/kg Since state 2 is superheated, the liquid level falls. Extra Problem What would happen to the liquid level in the last example if the specific volume had been 0.001 m3/kg and the pressure was 8 MPa? For more information on how steam is used in industry, check out this site: www.eere.energy.gov/industry/bestpractices/steam.html
Equations of State The relationship among the state variables, temperature, pressure, and specific volume is called the equation of state. We now consider the equation of state for the vapor or gaseous phase of simple compressible substances. Ideal Gas Based on our experience in chemistry and physics we recall that the combination of Boyle’s and Charles’ laws for gases at low pressure result in the equation of state for the ideal gas as where R is the constant of proportionality and is called the gas constant and takes on a different value for each gas.If a gas obeys this relation, it is called an ideal gas. We often write this equation as
The gas constant for ideal gases is related to the universal gas constant valid for all substances through the molar mass (or molecular weight). Let Ru be the universal gas constant. Then, The mass, m, is related to the moles, N, of substance through the molecular weight or molar mass, M, see Table A-1. The molar mass is the ratio of mass to moles and has the same value regardless of the system of units. Since 1 kmol = 1000 gmol or 1000 gram-mole and 1 kg = 1000 g, 1 kmol of air has a mass of 28.97 kg or 28,970 grams. The ideal gas equation of state may be written several ways.
P = absolute pressure in MPa, or kPa = molar specific volume in m3/kmol T = absolute temperature in K Ru = 8.314 kJ/(kmolK) Here Some values of the universal gas constant are Universal Gas Constant, Ru 8.314 kJ/(kmolK) 8.314 kPam3/(kmolK) 1.986 Btu/(lbmolR) 1545 ftlbf/(lbmolR) 10.73 psiaft3/(lbmolR)
The ideal gas equation of state can be derived from basic principles if one assumes 1. Intermolecular forces are small. 2. Volume occupied by the particles is small. Example 2-5 Determine the particular gas constant for air and hydrogen.
The ideal gas equation of state is used when (1) the pressure is small compared to the critical pressure or (2) when the temperature is twice the critical temperature and the pressure is less than 10 times the critical pressure. The critical point is that state where there is an instantaneous change from the liquid phase to the vapor phase for a substance. Critical point data are given in Table A-1. Compressibility Factor To understand the above criteria and to determine how much the ideal gas equation of state deviates from the actual gas behavior, we introduce the compressibility factor Z as follows. or
For an ideal gas Z = 1, and the deviation of Z from unity measures the deviation of the actual P-V-T relation from the ideal gas equation of state. The compressibility factor is expressed as a function of the reduced pressure and the reduced temperature. The Z factor is approximately the same for all gases at the same reduced temperature and reduced pressure, which are defined as where Pcrand Tcrare the critical pressure and temperature, respectively. The critical constant data for various substances are given in Table A-1. This is known as the principle of corresponding states. Figure 3-51 gives a comparison of Z factors for various gases and supports the principle of corresponding states.
When either P or T is unknown, Z can be determined from the compressibility chart with the help of the pseudo-reduced specific volume, defined as Figure A-15 presents the generalized compressibility chart based on data for a large number of gases.
These charts show the conditions for which Z = 1 and the gas behaves as an ideal gas: 1.PR < 10 and TR > 2 or P < 10Pcr and T > 2Tcr 2.PR << 1 or P << Pcr Note: When PR is small, we must make sure that the state is not in the compressed liquid region for the given temperature. A compressed liquid state is certainly not an ideal gas state. For instance the critical pressure and temperature for oxygen are 5.08 MPa and 154.8 K, respectively. For temperatures greater than 300 K and pressures less than 50 MPa (1 atmosphere pressure is 0.10135 MPa) oxygen is considered to be an ideal gas. Example 2-6 Calculate the specific volume of nitrogen at 300 K and 8.0 MPa and compare the result with the value given in a nitrogen table as v = 0.011133 m3/kg. From Table A.1 for nitrogen