Multiscale Harmonic Analysis of Diffusion Geometries in Document Spaces
This document explores the application of multiscale harmonic analysis and diffusion geometries in various fields such as machine learning, data mining, bioinformatics, and web browsing. We demonstrate how using geometric harmonic analysis of empirical Markov processes provides a unified mathematical framework that underlies several successful methods in document ranking, information navigation, and modeling complex structures. Our analysis connects the spectral properties of Laplace operators to diffusion geometries, revealing algorithms that scale efficiently with data size. The methodologies outlined include nonlinear principal component analysis, kernel methods, and spectral graph theory.

Multiscale Harmonic Analysis of Diffusion Geometries in Document Spaces
E N D
Presentation Transcript
Diffusion Geometries in Document Spaces. Multiscale Harmonic Analysis. R .R. Coifman, S. Lafon, A. Lee, M. Maggioni, B.Nadler. F. Warner, S. Zucker. Mathematics Department Program of Applied Mathematics. Yale University
Our goal is to report on mathematical tools used in machine learning, document and web browsing, bio informatics, and many other data mining activities. The remarkable observation is that basic geometric harmonic analysis of empirical Markov processes provides a unified mathematical structure which encapsulates most successful methods in these areas. relations These methods enable global descriptions of objects verifying microscopic (like calculus). In particular we relate the spectral properties of Laplace operators (on discrete data ) with the corresponding intrinsic multiscale folder structure induced by the diffusion geometry of the data (generalized Heisenberg principle)
This calculus with digital data provides a first step in addressing and setting up many of the issues mentioned above ,and much more, including multidimensional document rankings extending Google, information navigation, heterogeneous material modeling, multiscale complex structure organization etc. Remarkably this can be achieved with algorithms which scale linearly with the number of samples. The methods described below are known as nonlinear principal component analysis, kernel methods, support vector machines, spectral graph theory, and many more They are documented in literally hundreds of papers in various communities. A simple description is given through diffusion geometries. We will now provide a sketch of the basic ideas and potential applicability.
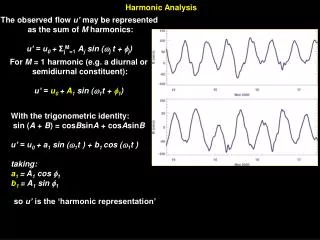
Diffusions between A and B have to go through the bottleneck ,while C is easily reachable from B. The Markov matrix defining a diffusion could be given by a kernel , or by inference between neighboring nodes. The diffusion distance accounts for preponderance of inference . The shortest path between A and C is roughly the same as between B and C . The diffusion distance however is larger since diffusion occurs through a bottleneck.
Diffusion as a search mechanism. Starting with a few labeled points in two classes , the points are identified by the “preponderance of evidence”. (Szummer ,Slonim, Tishby…)
Conventional nearest neighbor search , compared with a diffusion search. The data is a pathology slide ,each pixel is a digital document (spectrum below for each class )
Another simple empirical diffusion matrix A can be constructed as follows Let represent normalized data ,we “soft truncate” the covariance matrix as A is a renormalized Markov version of this matrix The eigenvectors of this matrix provide a local non linear principal component analysis of the data . Whose entries are the diffusion coordinates These are also the eigenfunctions of the discrete Graph Laplace Operator. This map is a diffusion (at time t) embedding into Euclidean space
As seen above on the spectra of various powers of a Diffusion operator A . The numerical rank of the powers are reduced . This corresponds to a natural multiresolution wavelet or Littlewood Paley analysis on the set . Orthonormal scaling functions and corresponding wavelets can be constructed (even in the non symmetric case)
A simple application of this diffusion on data ,or data filters is the Feature based diffusion algorithms ,sometimes called collaborative filtering. Given an image, associate with each pixel p a vector v(p) of features . For example a spectrum, or the 5x5 subimage centered at the pixel ,or any combination of features . Define a Markov filter as The various powers of A or polynomials in A provide filters which account for feature similarity between pixels .
Feature diffusion filtering (by A. Szlam) of the noisy Lenna image is achieved by associating with each pixel a feature vector (say the 5x5 subimage centerd at the pixel) this defines a Markov diffusion matrix which is used to filter the image ,as was done in for the spiral in the preceding slide
The long term diffusion of heterogeneous material is remapped below . The left side has a higher proportion of heat conducting material ,thereby reducing the diffusion distance among points , the bottle neck increases that distance
Diffusion map into 3 d of the heterogeneous graph The distance between two points measures the diffusion between them.
The First two eigenfunctions organize the small images which were provided in random order
Organization of documents using diffusion geometry
We claim that the self organization provided through the diffusion coordinates of the data ,is mathematically equivalent to a multiscale “folder” structure on the data A structure that can be obtained directly through basic multiscale diffusion “book keeping” The characteristic functions of the folders can be used to define diffusion wavelets or filters . ( detailed Wavelet Analysis is provided by M .Maggioni in his talk.)
A very simple way to build a hierarchical multiscale folder structure is as follows. We define the diffusion distance between two subsets E and F as :
To build a multiscale hierarchy of folders we start with a cover of the “document graph” with disjoint sets of rough diameter 1 at scale 1 . We then organize this metric space into a disjoint collection of folders whose diffusion diameter at scale 2 is roughly 1 . Each such collection of folders is a parent folder, we repeat on the parent folders using the diffusion distance at scale 4, and rough diameter 1 to combine them into grandparents, etc . This construction extends the usual binary coordinates on the line and does not build clusters it merely organizes the data.
In general given a data matrix such as a word frequency matrix in a body of documents , there are two folder structures ,one on the columns documents graph the other on the words graph . In the document graphs, folders correspond to affinity between documents while on the words, folders are meta words or conceptual functional groups (as seen in the documents). In the image below our “body of documents” are all 8x8 subimages of a simple image of a white disk on black background . The documents are labeled by a central pixel .The folders at different diffusion scales are the geometric features derived from this data set . The only input into the construction is the infinitesimal affinity between patches .
EEG Graphs • Green = most visited state, Blue = no state, Red = 3 remaining states • States defined via pattern of frontal electrodes (F7, Fp1,Fp2,F8) • Three graphs for “graph” and three for Beltrami – one using only front, one using a mix (indicated in figure), and one using all