Download
1 / 8
80 likes | 348 Vues
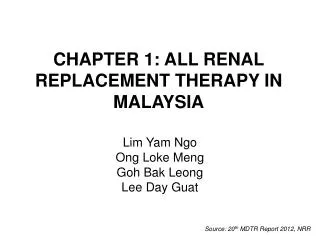
Chapter 1 ALL RENAL REPLACEMENT THERAPY IN MALAYSIA. Lim Yam Ngo Ong Loke Meng Goh Bak Leong Lee Day Guat. Source: 21 st MDTR Report 2013, NRR. Table 1.1: Stock and flow of RRT, Malaysia 2004-2013. Source: 21 st MDTR Report 2013, NRR.

E N D
Chapter 1ALL RENAL REPLACEMENT THERAPY IN MALAYSIA Lim Yam NgoOng Loke MengGoh Bak Leong Lee Day Guat Source: 21st MDTR Report 2013, NRR
Table 1.1: Stock and flow of RRT, Malaysia 2004-2013 Source: 21st MDTR Report 2013, NRR
Figure 1.1: Stock and flow of RRT, Malaysia 2004-2013(a) New dialysis and transplant patients New Dialysis New Transplant 200 6,500 6,000 180 5,500 160 5,000 140 4,500 4,000 120 No. of patients 3,500 No. of patients 100 3,000 80 2,500 2,000 60 1,500 40 1,000 20 500 0 0 2004 2005 2006 2007 2008 2009 2010 2011 2012 2013 2004 2005 2006 2007 2008 2009 2010 2011 2012 2013 Year Year Stock and Flow-New Dialysis patients 2004-2013 Stock and Flow-New Transplant patients 2004-2013 Source: 21st MDTR Report 2013, NRR
Figure 1.1: Stock and flow of RRT, Malaysia 2004-2013(b) Patients dialysing and with functioning transplant at 31st December, 2004-2013 Functioning transplant at 31st Dec Dialysing at 31st Dec 2,000 33,000 1,800 30,000 27,000 1,600 24,000 1,400 21,000 1,200 18,000 No. of patients No. of patients 1,000 15,000 800 12,000 600 9,000 400 6,000 200 3,000 0 0 2004 2005 2006 2007 2008 2009 2010 2011 2012 2013 2004 2005 2006 2007 2008 2009 2010 2011 2012 2013 Year Year Functioning Transplant at 31st Dec 2004-2013 Dialysing at 31st Dec 2004-2013 Source: 21st MDTR Report 2013, NRR
Table 1.2: New dialysis acceptance rate and new transplant rate per million population, 2004-2013 Source: 21st MDTR Report 2013, NRR
Figure 1.2: New dialysis acceptance and new transplant rate, 2004-2013 Transplant Dialysis 8 220 200 180 6 160 140 Rate, per million population 120 Rate, per million population 4 100 80 60 2 40 20 0 0 2004 2005 2006 2007 2008 2009 2010 2011 2012 2013 2004 2005 2006 2007 2008 2009 2010 2011 2012 2013 Year Year New Dialysis Acceptance Rate, 2004-2013 New Transplant Rate, 2004-2013 Source: 21st MDTR Report 2013, NRR
Table 1.3: RRT prevalence rate per million population, 2004-2013 Source: 21st MDTR Report 2013, NRR
Figure 1.3: Dialysis and transplant prevalence rate per million population, 2004-2013 Dialysis Transplant 1,100 70 1,000 60 900 800 50 700 40 Rate, per million population 600 Rate, per million population 500 30 400 300 20 200 10 100 0 0 2004 2005 2006 2007 2008 2009 2010 2011 2012 2013 2004 2005 2006 2007 2008 2009 2010 2011 2012 2013 Year Year Dialysis prevalence rate, 2004-2013 Transplant prevalence rate, 2004-2013 Source: 21st MDTR Report 2013, NRR