Download
1 / 36
360 likes | 533 Vues
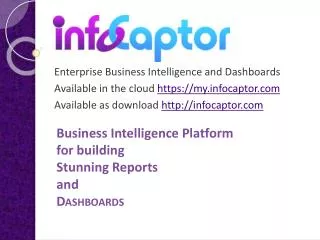
Enterprise Business Intelligence and Dashboards Available in the cloud https://my.infocaptor.com Available as download http://infocaptor.com. Business Intelligence Platform for building Stunning Reports and Dashboards. Benefits. Dynamic Visual Dashboards

E N D
Enterprise Business Intelligence and Dashboards Available in the cloud https://my.infocaptor.com Available as download http://infocaptor.com Business Intelligence Platform for building Stunning Reports and Dashboards
Benefits • Dynamic Visual Dashboards • Gain Quick Insights into your Business • Bird’s Eye view of entire operation • Track important social metrics
Benefits • InfoCaptor brings gaming elements into Dashboards • Dashboards can now sing and dance • Visual Alerts • Motion Alerts • Sound Alerts • Email Alerts • Dashboards can now be really fun to use
Pie and donut charts – useful for shares, splits and distributions
Exception reporting Format any data cells based on thresholds you set
GFX and sound effects with email alerts • When you wish to notify of any data change you can alert in multiple ways • Change colors • Shake or dance the widgets • Play a sound or siren • Email to people
Dashboard controls slice and dice data Drop down single and multi select Radio and checkboxes Text Fields Date Picker
Human Resource Dashboard Easy Interactive controls and unlimited Drill down options
Simple dashboard look and feel Drill down from pie chart to bar charts
Dashboards on TV – Realtime Put dashboards on Big screen TV and have fun with Data
Track Facebook Metrics Display information on any widget such as Sticky Notes
Modern style dashboard Display information on any widget such as Sticky Notes
Features • Global filters/prompts for slicing • Drill down from one chart to another • Drill down from one dashboard to another • Bring information from multi data sources into one page view • Built in Flowchart engine • Built in prototyping engine • Data-aware widgets, each and every widget (including flow chart lines) can show any information • Logical groups for functional purpose (e.g sales, finance, marketing etc) • Easy sharing of projects and dashboard between groups and users • Enterprise grade user access control • LDAP Integration/authentication
Flowchart engine • InfoGraphic style dashboards are easier to digest and understand. The flowchart engine allows for building live infographics • Indicate a flow of information using flowchart lines and symbols • Use it for building static flowcharts
Action Framework • Provide multiple ways to interact with controls • Controls can filter/slice and dice data • Data widgets can pass information back to other widgets • Provide unlimited Drill down within the same dashboard or external applications • Each and every widget/chart/grid has the capacity to control other child widgets
Capture Database information • Connect to any SQL database directly • Oracle • MySQL • SQL Server • DB2 • SQLite • PostgreSQL • Excel • Access • Any database supporting ODBC or JDBC
Capture any information • Connect to any Web service • Extract information from XML using xpath (http://www.infocaptor.com/help/xml.htm) • HTTP Post • HTTP Get • JSON/XML/HTML/Text data types • Write your own API and fetch using POST/GET
HTML5 Charting Engine • BI vendors like Oracle and Microstrategy use Flash for the charting engine • This gives inconsistent experience between desktop and mobile display • InfoCaptor charting is built on top of HTML5 and shows the same both on desktop or mobile • Looks the same on your iPad or iPhone
Prebuilt Social Metrics • Just provide your URL or ID and start tracking metrics from social accounts • Facebook (likes,shares,followers,comments) • Twitter (followers,tweets etc) • Feedburner • Google Analytics • Alexa • More (google alerts, youtube, RSS etc)
Enterprise collaboration • Organize dashboards into projects • Create logical groups for departments and group of users • Share projects to groups • Add or remove users from groups • Share dashboards with single URL • Share dashboards privately to users and projects
Completely web based – Easy integration • InfoCaptor is completely web based and does not require any Java or Flash plugins • It can integrate easily with your ERP, MRP and CRM systems • It can be the visualization layer for your datawarehouse • It can do reports on top of your Bug system or Help desk system • Directly embed dashboards inside portal pages/sharepoint and other CMS systems
Pricing and Licensing • Available as annual pricing (includes one admin/developer account) • 20 User license starts at $2599/year • 10 user license @ $1399/year • Additional users @ $119/year • Custom quote for 100 users or more • Other Licensing • OEM and White label license available for integrating with your own products
Your options • Join and use dashboards online at https://my.infocaptor.com • Download and run it on your Server http://www.infocaptor.com • Call us today at 412-532-6273 • Learn how your organization can benefit by using InfoCaptor • Build Dashboard POC with your data • Email : contact@infocaptor.com