Download

1 / 13
130 likes | 262 Vues
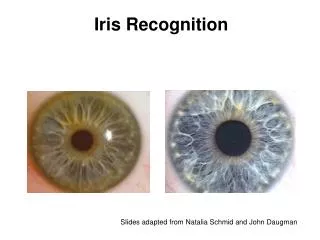
Preliminary images of IRIS. Hui Tian 07/19/2013. SJI 1400 filter (slit crossing the plage ). Emission components (e.g., Teriaca et al. 2008) (1) Si IV and other line emission formed in the transition region (2) UV continue emission formed 200 km above the temperature minimum .

E N D
Preliminary images of IRIS HuiTian 07/19/2013
SJI 1400 filter (slit crossing the plage) Emission components (e.g., Teriaca et al. 2008) (1) Si IV and other line emission formed in the transition region (2) UV continue emission formed 200 km above the temperature minimum
FUV spectrum for the slit C II 1334.53 Å C II 1335.71 Å O I 1355.60 Å C I 1355.84 Å Cl I 1351.66 Å Si IV 1393.76 Å O IV 1401.16 Å Si IV 1402.77 Å
Closer look at the Si IV 1402 line: transition region explosive events (EEs, bidirectional reconnection outflows, e.g., Innes et al. 1997) are far more frequent than what SUMER found – important implication for nanoflare heating! Si IV 1402 line profiles at 2 slit locations
Single Gaussian fit to a normal line profile & triple Gaussian fit to an EE line profile Typical velocities of EEs are 40 km/s, sometimes enhanced wing emission indicative of velocity of ~100 km/s
SJI 2832 filter (slit crossing a sunspot) Emission mainly from Mg II wing which is formed in the photosphere
NUV spectrum for the slit Mg II h 2803 Å Mg II k 2796 Å
Closer look at the Mg II k&h lines: The central reversals of the Mg II lines disappear in sunspots – Very similar to the H Lyman line profiles, indicating reduced opacity in sunspots (Tian et al. 2009) plage sunspot Mg II k line profiles at 2 slit locations
Another interesting NUV spectrum Mg II h 2803 Å Mg II k 2796 Å
EEs at Mg II lines? Mg II k line profiles at 2 slit locations Obviously enhanced emission at both wings of the Mg II line: roughly 40 km/s away from the line center. Are these bidirectional reconnection outflows or rotational motion? (Curdt & Tian 2011, Sekse et al. 2013)
1400 @20130718_110104 Lower chromosphere and TR 1330 @20130718_032718 Lower chromosphere and TR SJI images of an AR 1330 Not yet found a 2796 image for this AR 2832 @20130718_110214 Photospheric emission
Compare SJI 1400 with AIA 1600 IRIS SJI 1400 @20130718_110104 AIA 1600 @20130718_104617 Transition region emission can clearly be seen in the SJI 1400 images. These elongated structures are very likely to bridge between the chromosphere and corona. Investigation of these features might yield important results on the mass and energy supply to the corona from the lower atmosphere.
SJI 2796 images at the limb 2832 @20130718_211740 Chromospheric emission 2832 @20130718_193745 Chromospheric emission Spicules can be clearly seen Prominences are well observed