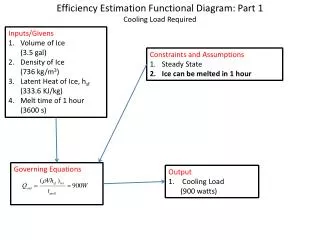
Download
1 / 17
170 likes | 306 Vues
High resolution modelling of the decreasing Arctic sea ice Kristine S. Madsen, T.A.S. Rasmussen, J. Blüthgen and M.H. Ribergaard Polar Oceanography, Danish Meteorological Institute. Sea ice volume, 10 13 m 3. Oil drift 17 days after initial spill. Overview. Model introduction

E N D
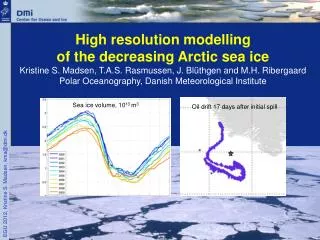
High resolution modelling of the decreasing Arctic sea iceKristine S. Madsen, T.A.S. Rasmussen, J. Blüthgen and M.H. RibergaardPolar Oceanography, Danish Meteorological Institute Sea ice volume, 1013 m3 Oil drift 17 days after initial spill
Overview Model introduction Sea ice changes • Extend • Volume • Ocean surface temperature Oil drift modelling • Surface spill • Deep spill • Importance of sea ice
HYCOM/CICE ocean and sea ice model • North Atlantic and Arctic oceans • ~10 km horizontal resolution • Sea ice: dynamic and thermodynamic • Ocean: hydrodynamic, 29 vertical levels (hybrid) • ERA Interim atm. forcing, 2000–2009 • Assimilate sea ice concentration and SST from satellite once a day, nudge towards climatological SSS
The CICE model • Hibler-type elastic-viscous-plastic ice model • Each grid cell has 5 ice thickness categories with 4 vertical layers for each, plus surface snow • Horizontal resolution and time step same as ocean model (~10 km, 5 minutes)
Model Observations Sea ice concentration Sea ice area (concentration ≥ 30%), 1012 m2 Source: ocean.dmi.dk/arctic
Sea ice concentration 2001 2007 Units: %
Sea ice concentrations – September 1 Model Units: % Observations Source (observations): U. of Illinois The Cryosphere Today
Sea ice thickness – September 1 2007 2001 Units: m
Model Sea ice volume Units: 1013 m3
Ocean surface layer temperature Average for all ocean points north of 80°N, units °C
Ocean surface layer temperature Average for ocean points w. at least 30% ice, north of 80°N, units °C
Summary – sea ice • The model reproduces concentration (within 10%) and timing of min and max sea ice concentration, but builds up ice too fast in the fall. • The interannual variability is well represented. • Sea ice volume shows continuous build-up from October to May and strong decrease in June. • 2007 shows large volume decrease and export along Greenland’s east coast. 2008 and 2009 has lower ice volume than 2007. • Summer polar ocean surface layer temperature is increased in summer 2007, also underneath the sea ice.
Oil drift modeling Existing hydrocarbon exploration & exploitation licences Applications for new licences 2012/13
DMI oil drift module • Purposes: oil combating, “find the sinner”, drifting vessel, man overboard • Particle model • Passive advection with ocean current • … and additional surface wind drift (3%) • Wind speed is scaled inverse linear with sea ice concentration. • Future work: Ocean speed is scaled inverse linear with sea ice concentration towards ice velocity. • Buoyant rising (or sinking) • Downward mixing by wind waves (scaled by wind speed + random distribution) • Turbulent spreading (random walk scaled by current speed) • Oil weathering • 8 pre-defined oil-types - based on fractions of 8 hydrocarbons • Instantaneous or continuous oil spill at any depth • Runs operationally, 15 minutes response 24-7 http://www.itopf.com
2 deg ~200 km Example of oil drift Imaginary surface spill on August 1-10 2003 south-east of Greenland
Oil drift in sea ice affected areas • Wind drag limited (already included in model) • Oil will partly drift with the ice • Oil will be trapped in pockets under the ice or freeze into the ice – reducing weathering
Thank you! Sea ice volume, 1013 m3 Oil drift 17 days after initial spill