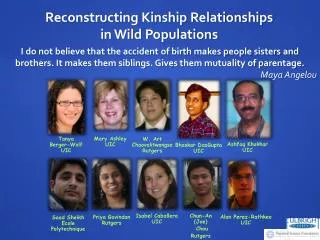
Reconstructing Sibling Relationships from Genotyping Data
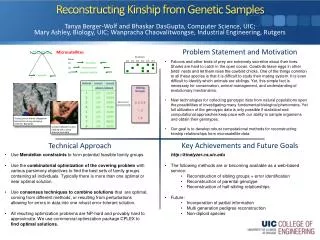
This study explores methods for reconstructing sibling relationships from genetic data, vital in fields like conservation biology, molecular ecology, and genetic epidemiology. It particularly focuses on estimating heritability of traits, characterizing mating systems, and assessing fitness. We examine challenges of sampling parent-offspring pairs, utilizing juvenile cohorts instead. The research highlights techniques for effective sibling group identification using allele data, microsatellites, and likelihood ratios, thereby advancing methodologies for animal management and conservation efforts.

Reconstructing Sibling Relationships from Genotyping Data
E N D
Presentation Transcript
Saad Sheikh Department of Computer Science University of Illinois at Chicago ? Brothers! ? Reconstructing Sibling Relationships from Genotyping Data
Biological Motivation • Used in: conservation biology, animal management, molecular ecology, genetic epidemiology • Necessary for: estimating heritability of quantitative characters, characterizing mating systems and fitness. Lemon sharks, Negaprionbrevirostris • But: hard to sample parent/offspring pairs. Sampling cohorts of juveniles is easier 2 Brown-headed cowbird (Molothrusater) eggs in a Blue-winged Warbler's nest
Basic Genetics • Gene • Unit of inheritance • Allele • Actual genetic sequence • Locus • Location of allele in entire genetic sequence • Diploid • 2 alleles at each locus
Siblings: two children with the same parents Question: given a set of children, find sibling groups allele locus father(.../...),(a /b ),(.../...),(.../...) one from fatherone from mother Diploid Siblings (.../...),(c /d ),(.../...),(.../...) mother recombination (.../...),(e /f ),(.../...),(.../...) child
CACACACA 5’ Alleles CACACACA #1 CACACACACACA #2 #3 CACACACACACACA Genotypes 1/1 2/2 1/2 1/3 2/3 3/3 Microsatellites (STR) • Advantages: • Codominant (easy inference of genotypes and allele frequencies) • Many heterozygous alleles per locus • Possible to estimate other population parameters • Cheaper than SNPs • But: • Few loci • And: • Large families • Self-mating • …
Sibling Groups: 2, 4, 5, 6 1, 3 7, 8 Sibling Reconstruction Problem Animal Locus1 Locus2 allele1/allele2 1 1/2 11/22 2 1/3 33/44 3 1/4 33/55 4 1/3 77/66 5 1/3 33/44 33/77 6 1/3 7 1/5 88/22 8 1/6 22/22 S={P1={2,4,5,6},P2={1,3},P3={7,8}}
David C. Queller and Keith F. Goodnight. Computer software for performing likelihood tests of pedigree relationship using genetic markers. Molecular Ecology, 8:1231–1234, 1999. KINSHIP
KINSHIP • First software and likelihood measure for sibling/kinship reconstruction • Estimates a ratio of two likelihoods: • Primary vs. Null Hypothesis • Assumes Population Frequencies are known
Probability of sharing allele • R – Probability of alleles being identical by descent • Rp = Probability (Xp = Yp) • Rm = Probability (Xm = Ym)
Haploid Likelihood • Two individuals X =<X> and Y=<Y> • If X=Y • Likelihood = Pr(Drawing X) x Pr(X = Y) • =R+(1-R)Px • Otherwise • Likelihood = Pr(Drawing X) x Pr(X Y) • =Px(1-R)Py
Diploid Individuals • Diploid Individuals X=<Xp/Xm>, Y =<Yp/Ym> • Assumptions • We know which alleles are mother's and father's • No Inbreeding • Likelihood = Likelihoodp x Likelihoodm • Loci are independent • Total Likelihood is a product of likelihoods across loci
Calculating Likelihood • Population Frequencies: Pxm,Pxp,Pym,Pyp • Likelihoods:
Likelihood Ratios • Independent Likelihood is not very reliable or meaningful • Different Ratios => Different Loci • Ratio != Statistical Significance • Simulations used to determine P-values
Statistical Significance • Randomly generate an individual X using allele frequencies • Draw Y using Rm and Rp • First Allele: Copy X's allele with Probability Rm or vice versa • Second Allele: Copy X's allele with Probability Rp or vice versa • Draw a large number of such <X,Y> pairs • The value of the ratio that excludes 95% of such pairs is at P=0.05 significance
Jen Beyer and B. May. A graph-theoretic approach to the partition of individuals into full-sib families. Molecular Ecology, 12:2243–2250, 2003. Family Finder
Graph-Theory? • Build a graph of all individuals • Connect individuals with edges representing relationships • Assign Likelihood Ratio Full Sib/Unrelated as distance measure • Filter using likelihood ratio at 0.05 significance level • Find a cut
Algorithm • Calculate LFS/LUR likelihood ratios for all pairs • Build a graph representing the full-sib relationships • Find the connected components in the graph and store them in a queue. • While the queue is not empty do • Remove a component from the queue and calculate its score. • Build a GH cut tree for the component. • For each cut with less than 1/3 the total number of edges in the component do • Score the components that would result if the cut's edges were removed. • If the scores are the best found so far, then store them. • If the best scores found are higher than the score for the original component • then separate the families and put them in the queue for further analysis. • Otherwise save the original component as a result family.
Example Score the components and Keep the best cuts
Conclusion – Family Finder • Some theoretical basis • Efficiently computable • Produces reasonably good results for many loci • A lot of assumptions because of Goodknight & Queller measure • Requires a significant number of loci - 8+ • Works well only when families are almost equal size
Parsimony • Parsimony=Occam’s Razor • "entities must not be multiplied beyond necessity” • "plurality should not be posited without necessity” • “Parsimony is a 'less is better' concept of frugality, economy or caution in arriving at a hypothesis or course of action. The word derives from Middle English parcimony, from Latin parsimonia, from parsus, past participle of parcere: to spare. It is a general principle that has applications from science to philosophy and all related fields. Parsimony is essentially the implementation of Occam's razor.” • Wikipedia • Min Sib groups = Most Parsimonious explanation
Mendelian Constraints 4-allele rule:siblings have at most 4 different alleles in a locus Yes: 3/3, 1/3, 1/5, 1/6 No:3/3, 1/3, 1/5, 1/6, 3/2 2-allele rule: In a locus in a sibling group: a + R ≤ 4 Yes: 3/3, 1/3, 1/5 No: 3/3, 1/3, 1/5, 1/6 Num distinct alleles Num alleles that appear with 3 others or are homozygote
Min Sibgroups Reconstruction • Find the minimum number of Sibling Groups necessary to explain the given cohort • Minimum Set Cover: • Cohort as universe U • Individuals as elements of U • Covering Groups C include all genetically feasible sibling groups • NP-complete even when we know sibsets at most 3 • Hard to approximate (Ashley et al. 09) • ILP formulation (Chaovalitwongse et al. 08)
Given: universe U = {1, 2, …, n} collection of sets S = {S1, S2,…,Sm} where Si subset of U Find: the smallest number of sets in S whose union is the universe U Minimum Set Cover Minimum Set Cover is NP-hard (1+ln n)-approximable (sharp)
2-Allele Min Set Cover • Generate all maximal feasible sibling groups (sets) that satisfy 2-allele property using “2-Allele Algorithm” [ISMB 2007; Bioinformatics 23(13)] • Use Min Set Cover to find the minimum sibling groupsOptimally using ILP (CPLEX)
2-Allele Algorithm Overview • Generate candidate sets by all pairs of individuals • Compare every set to every individual x • if x can be added to the set without any affecting “accomodability” or violating 2-allele: • add it • If the “accomodability” is affected , but the 2-allele property is still satisfied: • create a new copy of the set, and add to it • Otherwise ignore the individual, compare the next
4/1 2/3 2/1 3/1 2/1 1/3 3/2 2/1 3/1 1/1 1/1 1/2 2/2 1/2 1/3 1/4 2/3 2/4 3/1 3/2 4/2 2/1 1/1 1/2 2/1 1/1 1/3 1/3 2/1 2/3 2/1 3/2 Canonical families 1/3 2/2 1/1 1/2 1/4 2/3 2/4 3/4 3/3 4/4
1/4 1/4 1/4 Examples • Add • New Group Add (won’t accommodate (2/2)) • Can’t add (a+R =4) 3/ 4 1/ 2 3/ 2 1/ 2 3/ 2 3/ 2 1/ 1 1/ 2 1/ 5
Testing and Validation: Protocol • Get a dataset with known sibgroups(real or simulated) • Find sibgroups using our alg • Compare the solutions • Partition distance, Gusfield’03 • Compare results to other sibship methods
Salmon (Salmosalar) - Herbingeret al., 1999 351 individuals, 6 families, 4 loci. No missing alleles Shrimp (Penaeusmonodon) - Jerry et al., 200659 individuals,13 families, 7 loci. Some missing alleles Ants (Leptothoraxacervorum )- Hammond et al., 1999Ants dataset [16] are haplodiploid species. The data consists of 377 worker diploid ants Real Data
Generate F females and M males (F=M=5, 10, 15) Each with l loci (l=2, 4, 6) Each locus with a allelesa[uniform]=5, 10, 15 a[nonuniform]=4 12-4-1-1 Generate f familiesf[uniform]=2, 5, 10 f[nonuniform]=5 For each family select female+male uniformly at random For each parent pair generate o offspringo[uniform]=2, 5, 10 o[nonuniform]=25-10-10-4-1 For each offspring for each locus choose allele outcome uniformly at random Random Data Generation
Summary (Min Sib Groups) • 2-Allele Min Set Cover • First combinatorial • Makes no assumptions other parsimony • Works consistently and comparatively • Sibling Reconstruction • Growing number of methods • Biologists need (one) reliable reconstruction • Genotyping errors • Answer: Consensus
S2 Sk S Consensus Methods • Combine multiple solutions to a problem to generate one unified solution • C: S*→ S • Based on Social Choice Theory • Commonly used where the real solution is not known e.g. Phylogenetic Trees Consensus ... S1
Strict Consensus • Only Pareto Optimality and Anti-Pareto Optimality are enforced • All solutions must agree on equivalence • All disputed individuals go to singletons Si x≡Siy≡ x≡Sy S1 = {{1,2,3},{4,5},{6,7} S2={{1,2,3,4},{5,6,7}} S3={{1,2},{3,4,5},{6,7}} Strict Consensus S={{1,2},{3},{4},{5},{6,7}} 5 Sibling Groups? When 3 can do?
Majority Consensus • Majority of solutions determine the final solution • Two individuals are together if a majority of solutions vote in their favour • Violates Transitivity: A≡B∧B≡C⇒A≡C S1 = {{1,2,3},{4,5},{6,7} S2={{1,2,3,4},{5,6,7}} S3={{1,2},{3,4,5},{6,7}} 1 ≡ 3 AND 3 ≡ 4 BUT 1 ≡ 4
Majority Consensus • Voting Consensus • Majority under closure • Results in large monolithic groups S1 = {{1,2,3},{4,5},{6,7} S2={{1,2,3,4},{5,6,7}} S3={{1,2},{3,4,5},{6,7}} Voting Consensus S={{1,2,3,4,5},{6,7}} 1 ≡5?
Consensus Methods • Commonly used consensus methods don’t work [AAAI-MPREF08] • Strict Consensus produces too many singletons • Majority violates transitivity AND doesn’t work for error-tolerance
fq S S2 S1 Sk Ss fd Distance-based Consensus • Algorithm • Compute a consensus solution S={g1,...,gk} • Search for a good solution near S fq fd Search Consensus ...
Distance-based Consensus • Needs • A Distance Function fd: S x S →R • A Quality Function fq: S → R • What is the Catch? [Sheikh et al. CSB 2008] • Optimization of fd, fq or an arbitrary linearcombination is NP-Complete • Reduction from the 2-Allele Min Set CoverProblem
A Greedy Approach • Algorithm • Compute a strict consensus • While distance is not too large • Merge two nearest sibgroups • Quality: fq=n-|C| • Distance Function • fd(C,C’)=cost of merging groups in C to obtain C’
A Greedy Approach • S1 ={ {1,2,3}, {4,5}, {6,7} } • S2={ {1,2,3}, {4}, {5,6,7} } • S3={ {1,2}, {3,4,5}, {6,7} } Strict Consensus S={ {1,2}, {3},{4},{5},{6,7} } S={ {1,2}, {3,6,7},{4},{5} }
Greedy Consensus • Distance Function(sibgroup, sibgroup) • Cost of assigning all individuals • fd(C,C’)=min(SXPifassign(Pj,X), SXPjfassign(Pi,X) ) • Distance Function (sibgroup, individual) • Benefit: Alleles and allele pairs shared • Cost: Minimum Edit Distance • fassign(PiX)= benefit X can be a member of Pi cost X cannot be a member of Pi`
Greedy Consensus • Algorithm • Compute a strict consensus • While distance is not too large • Merge two sibgroups which will minimize the TOTAL merging cost • Store the new merging cost in the merged set
S2 Sk S Error-Tolerant Approach ... Locus 1 Locus 2 Locus 3 Locus k Sibling Reconstruction Algorithm ... Consensus S1
Results • >90% accuracy for all real data
Impossibility Result • A consensus method CANNOT be all of these [Arrow 1963,Mirkin 1975] • Fair • Independent • Pareto Optimal • Biologically [AAAI-MPREF 2008] • The subset of individuals chosen will impact the consensus considerably