Download

1 / 27
270 likes | 432 Vues
Corporate Finance: A Review of Project Valuation. Net Present Value (NPV). Recall that Net Present Value (NPV) measures a project’s contribution to shareholders’ wealth. NPV equals Present Value of a project’s future cash flows minus the initial investment. Net Present Value (NPV).

E N D
Net Present Value (NPV) • Recall that Net Present Value (NPV) measures a project’s contribution to shareholders’ wealth. • NPV equals Present Value of a project’s future cash flows minus the initial investment.
Net Present Value (NPV) • Step 1. Forecasting cash flows from a project. • Step 2. Estimating the expected return from a project, given the riskiness of the cash flows. • Step 3. Using the expected return to discount the future cash flows. • Step 4. Choosing to do the project if the net present value is positive
Internal Rate of Return (IRR) • Recall that Internal Rate of Return (IRR) is an alternate criterion for evaluating the worth of a project. • IRR is estimated by finding the discount rate at which project NPV equals zero, i.e.:
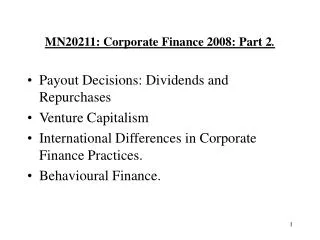
$1,200.00 Net Present Value Profile $1,000.00 $800.00 $600.00 NPV $400.00 IRR = 25.38% $200.00 $0.00 ($200.00) 0% 5% 10% 15% 20% 25% 30% Rate Net Present Value Profile • The Net Present Value Profile graphs the NPV of a project as discount rate changes. It is an effective way to summarize the value of a project as its risk profile changes.
Discounted Cash Flow Analysis • DCF Analysis involves estimating cash flows from a project, and accounting for: • Sales and revenues in a period t (Revt). • Cost of sales and expenses in time t (Costt ). • Depreciation in period t (Dept ). • Taxes in period t (Tax Rate Tc). • Working capital in period t (WCt).
Discounted Cash Flow Analysis • We can estimate after-tax income, add back depreciation, and add changes in working capital, to write: • Alternatively, we can work out after-tax cash flow from operations, add the tax effect of depreciation, and add changes in working capital, to write: • A third method can involve writing after-tax cash flows from each of the accounting variables:
Rule 1: Consider only Incremental Cash Flows • Focus on cash flows that occur if and only if the project is undertaken. These cash flows are a direct consequence of undertaking a project and are often called incremental cash flows.
Rule 2: Consider all Opportunity Costs • Opportunity costs are cash flows that could be generated provided the project being considered was not undertaken. Alternatively stated, these are cash flows foregone because the project is being undertaken.
Rule 3: Consider all Indirect Costs • Indirect costs or consequences of doing a project should form part of the costs associated with the project. • An interesting situation arises when a company introduces a new product that reduces the sales of its already existing product. This is often called cannibalization or erosion in finance lingo. Should these costs be considered when evaluating new products or services?
Rule 4: Ignore Sunk Costs • Sunk costs are costs that are incurred irrespective of whether a project is undertaken or not. These costs should be ignored in evaluating a project.
Rule 5: Ignore Financing Costs • Costs associated with financing a project such as interest expenses should be ignored. This may appear to be a gross violation of our earlier rules. After-all, these costs are a direct consequence of our decision to undertake a project. • The rationale for ignoring financing costs is as follows. The very process of the valuation of cash flows is designed to account for the financing costs. Hence, the cash flows we use to discount should be prior to the cost of financing the project.
Rule 6: Consider After-tax Cash Flows • Only after-tax cash flows should be considered in evaluating a project. The primary reason for this rule is that investors expect an appropriate rate of return from the project on an after-tax basis.
Rule 7: Account for Inflation • Typically, we should consider nominal cash flows from a project because the investors expect a nominal rate of return from a project.
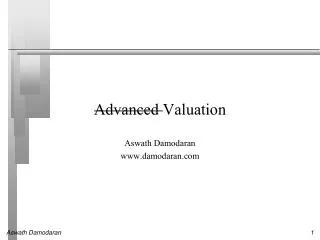
Year 0 Year 1 Year 2 Year 3 Year 4 Year 5 Year 6 1. Capital Investment -10,000 2. Working Capital 1,500 4,075 4,279 4,493 4,717 3,039 0 3. Change in Working Cap 1,500 2,575 204 214 225 -1,678 -3,039 4. Revenues 15,000 15,750 16,538 17,364 18,233 5. Expenses 10,000 10,500 11,025 11,576 12,155 6. Depreciation 2,000 2,000 2,000 2,000 2,000 7. Pretax Profit 3,000 3,250 3,513 3,788 4,078 8. Tax (35%) 1,050 1,137 1,230 1,326 1,427 9. Profit after tax 1,950 2,113 2,283 2,462 2,651 10. Add in depreciation 2,000 2,000 2,000 2,000 2,000 11. Cash from Operations 3,950 4,113 4,283 4,462 4,651 Example: Microsoft Corp. • Capital Investment (line 1). The project requires an investment of $100 million. It has a 5-year life at which time it will have zero salvage value.
Year 0 Year 1 Year 2 Year 3 Year 4 Year 5 Year 6 1. Capital Investment -10,000 2. Working Capital 1,500 4,075 4,279 4,493 4,717 3,039 0 3. Change in Working Cap 1,500 2,575 204 214 225 -1,678 -3,039 4. Revenues 15,000 15,750 16,538 17,364 18,233 5. Expenses 10,000 10,500 11,025 11,576 12,155 6. Depreciation 2,000 2,000 2,000 2,000 2,000 7. Pretax Profit 3,000 3,250 3,513 3,788 4,078 8. Tax (35%) 1,050 1,137 1,230 1,326 1,427 9. Profit after tax 1,950 2,113 2,283 2,462 2,651 10. Add in depreciation 2,000 2,000 2,000 2,000 2,000 11. Cash from Operations 3,950 4,113 4,283 4,462 4,651 Example: Microsoft Corp. • Working Capital (lines 2 and 3). Notice there is an increase in working capital requirements in the initial years and a decrease in later years.
Year 0 Year 1 Year 2 Year 3 Year 4 Year 5 Year 6 1. Capital Investment -10,000 2. Working Capital 1,500 4,075 4,279 4,493 4,717 3,039 0 3. Change in Working Cap 1,500 2,575 204 214 225 -1,678 -3,039 4. Revenues 15,000 15,750 16,538 17,364 18,233 5. Expenses 10,000 10,500 11,025 11,576 12,155 6. Depreciation 2,000 2,000 2,000 2,000 2,000 7. Pretax Profit 3,000 3,250 3,513 3,788 4,078 8. Tax (35%) 1,050 1,137 1,230 1,326 1,427 9. Profit after tax 1,950 2,113 2,283 2,462 2,651 10. Add in depreciation 2,000 2,000 2,000 2,000 2,000 11. Cash from Operations 3,950 4,113 4,283 4,462 4,651 Example: Microsoft Corp. • Revenues (line 4). Revenues grow at an inflation rate of 5%. • Expenses (line 5). Expenses also increase by the 5% inflation rate.
Year 0 Year 1 Year 2 Year 3 Year 4 Year 5 Year 6 1. Capital Investment -10,000 2. Working Capital 1,500 4,075 4,279 4,493 4,717 3,039 0 3. Change in Working Cap 1,500 2,575 204 214 225 -1,678 -3,039 4. Revenues 15,000 15,750 16,538 17,364 18,233 5. Expenses 10,000 10,500 11,025 11,576 12,155 6. Depreciation 2,000 2,000 2,000 2,000 2,000 7. Pretax Profit 3,000 3,250 3,513 3,788 4,078 8. Tax (35%) 1,050 1,137 1,230 1,326 1,427 9. Profit after tax 1,950 2,113 2,283 2,462 2,651 10. Add in depreciation 2,000 2,000 2,000 2,000 2,000 11. Cash from Operations 3,950 4,113 4,283 4,462 4,651 Example: Microsoft Corp. • Depreciation (line 6). Microsoft proposes to depreciate its facility using straight-line depreciation over 5 years.
Year 0 Year 1 Year 2 Year 3 Year 4 Year 5 Year 6 1. Capital Investment -10,000 2. Working Capital 1,500 4,075 4,279 4,493 4,717 3,039 0 3. Change in Working Cap 1,500 2,575 204 214 225 -1,678 -3,039 4. Revenues 15,000 15,750 16,538 17,364 18,233 5. Expenses 10,000 10,500 11,025 11,576 12,155 6. Depreciation 2,000 2,000 2,000 2,000 2,000 7. Pretax Profit 3,000 3,250 3,513 3,788 4,078 8. Tax (35%) 1,050 1,137 1,230 1,326 1,427 9. Profit after tax 1,950 2,113 2,283 2,462 2,651 10. Add in depreciation 2,000 2,000 2,000 2,000 2,000 11. Cash from Operations 3,950 4,113 4,283 4,462 4,651 Example: Microsoft Corp. • Tax (line 8). Company taxes are 35 percent of pretax profits.
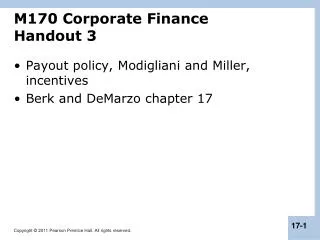
Yr 0 Yr 1 Yr 2 Yr 3 Yr 4 Yr 5 Yr 6 Capital investment -10,000 Working capital -1,500 -2,575 -204 -214 -225 1,678 3,039 Cash flow: operations 3,950 4,113 4,283 4,462 4,651 Total cash flow -11,500 1,375 3,909 4,069 4,237 6,329 3,039 Discounted CF @ 12% -11,500 1,228 3,116 2,896 2,693 3,591 1,540 NPV 3,564 Example: Microsoft Corp.
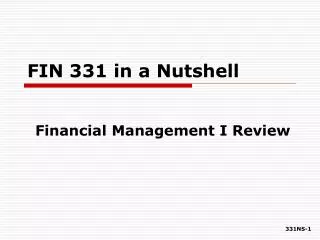
Replacement Decision:An Example • An old machine that is proposed to be replaced was purchased two years ago. • It is expected to last 6 more years and at the end of six years it can be sold for a market value of $500, which will also be its book value at that time. • Current book value of the machine is $2600 and its market value is $3000. • The company tax rate is 46%, real discount rate is 15%, inflation is expected to be at 5%, and the company uses straight-line depreciation.
Replacement Decision: An Example • The new machine costs $8000. It is expected to have a life of six years. • At the end of six years it can be sold for a market value of $800, which will also be its book value at that time. • The new machine will increase sales by $1000 each year and decrease expenses by $1500 each year. • It will need increased inventory holdings of $2000 and increased accounts payable of $500.
0 1 2 3 4 5 6 7 -8000 Purchase new m/c Sell old m/c 3000 -184 Tax effect of sale 540 540 540 540 540 540 After tax sales 810 810 810 810 810 810 After tax expenses 1143 1088 1037 987 940 895 Dep. new m/c -333 -317 -302 -288 -274 -261 Dep. old m/c 810 771 734 699 666 634 Dep. Increase 372 355 338 322 306 292 Tax effect: Dep. 800 Salvage new m/c -500 Salvage foregone -1500 1500 WC Change -5184 222 1705 1688 1672 1656 1642 1800 Cash Flow Replacement Decision:An Example
0 1 2 3 4 5 6 7 -8000 Purchase new m/c Sell old m/c 3000 -184 Tax effect of sale 540 540 540 540 540 540 After tax sales 810 810 810 810 810 810 After tax expenses 1143 1088 1037 987 940 895 Dep. new m/c -333 -317 -302 -288 -274 -261 Dep. old m/c 810 771 734 699 666 634 Dep. Increase 372 355 338 322 306 292 Tax effect: Dep. 800 Salvage new m/c -500 Salvage foregone -1500 1500 WC Change -5184 222 1705 1688 1672 1656 1642 1800 Cash Flow Replacement Decision:An Example
0 1 2 3 4 5 6 7 -8000 Purchase new m/c Sell old m/c 3000 -184 Tax effect of sale 540 540 540 540 540 540 After tax sales 810 810 810 810 810 810 After tax expenses 1143 1088 1037 987 940 895 Dep. new m/c -333 -317 -302 -288 -274 -261 Dep. old m/c 810 771 734 699 666 634 Dep. Increase 372 355 338 322 306 292 Tax effect: Dep. 800 Salvage new m/c -500 Salvage foregone -1500 1500 WC Change -5184 222 1705 1688 1672 1656 1642 1800 Cash Flow Replacement Decision:An Example
0 1 2 3 4 5 6 7 -8000 Purchase new m/c Sell old m/c 3000 -184 Tax effect of sale 540 540 540 540 540 540 After tax sales 810 810 810 810 810 810 After tax expenses 1143 1088 1037 987 940 895 Dep. new m/c -333 -317 -302 -288 -274 -261 Dep. old m/c 810 771 734 699 666 634 Dep. Increase 372 355 338 322 306 292 Tax effect: Dep. 800 Salvage new m/c -500 Salvage foregone -1500 1500 WC Change -5184 222 1705 1688 1672 1656 1642 1800 Cash Flow Replacement Decision:An Example
0 1 2 3 4 5 6 7 -8000 Purchase new m/c Sell old m/c 3000 -184 Tax effect of sale 540 540 540 540 540 540 After tax sales 810 810 810 810 810 810 After tax expenses 1143 1088 1037 987 940 895 Dep. new m/c -333 -317 -302 -288 -274 -261 Dep. old m/c 810 771 734 699 666 634 Dep. Increase 372 355 338 322 306 292 Tax effect: Dep. 800 Salvage new m/c -500 Salvage foregone -1500 1500 WC Change -5184 222 1705 1688 1672 1656 1642 1800 Cash Flow Replacement Decision:An Example