Download
1 / 49
500 likes | 715 Vues
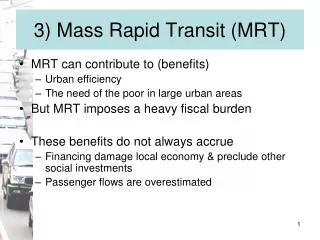
Cellular Mass Transit (CMT) CMT4Austin.org. Improve Public Transit with CMT. Cut wait time Reduce travel time Provide shelter for transfers Expand Coverage Increase Ridership. Why Improve Public Transit ?. Better Public Transit could save working poor $ 320 million a year

E N D
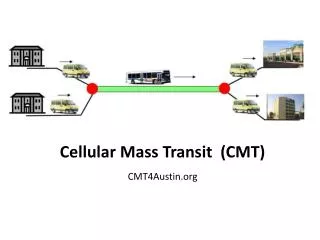
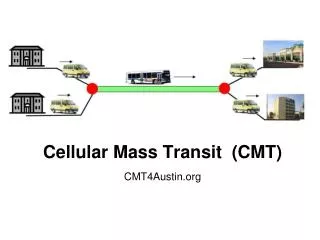
Cellular Mass Transit (CMT) CMT4Austin.org
Improve Public Transit with CMT Cut wait time Reduce travel time Provide shelter for transfers Expand Coverage Increase Ridership
Why Improve Public Transit ? Better Public Transit could save working poor $ 320 million a year Increase work destinations PT can reach Public Transit riders would jump 3 fold 80,000 riders x $4000 = $ 320 million/year
CMT = BRT + Shared Taxi Van Measures to speed bus travel Fast boarding gates Frequent Service Most vehicle miles by Van
Existing Service has Problems Too Slow Long Waits Poor Transfer Conditions
Poor Circulation in North Austin Existing Service Has gaps and 30 minute waits
OLD WAY : MANY TO ONE CMT : MANY TO MANY
Transfer from Circulator to Express Transit Center Floor Plan
Most circulator routes have a bus every 30 minutes Conventional Service : CMT would have a van every 10 minutes
Why Improve Public Transit ?? Better Public Transit could save working poor $ 320 million / year 270,000 workers making less than $ 28,000 per year $30K /Year is minimum for Basic Economic Security CMT would increase work destinations PT can reach from 22% to 80% Ridership would jump 3 fold from 40,000 to 120,000 CMT would bring in 80,000 new riders The service would cost riders less than $2,000 per year Yet Cars Cost $6000 a year Riders would save $4000 per year 80,000 new riders times $4000 = $320 million /year in savings
270,000 low wage workers making less than $28,000/YR Most are driving cars they can’t afford. Many need day care Bureau of Labor Statistics http://www.bls.gov/oes/current/oes_12420.htm
BEST table : Low wage workers need day care and can’ afford cars http://www.wowonline.org/documents/BESTIndexforTheUnitedStates2010.pdf
Brookings Institute says : Only one-quarter of jobs in low- and middle-skill industries are accessible via mass transit within 90 minutes for the typical metropolitan commuter from Missed Opportunity: Transit and Jobs in Metropolitan America http://www.brookings.edu/~/media/Files/Programs/Metro/jobs_transit/0512_jobs_transit.pdf
Employment by Zip Code 80 % of jobs are in low density areas, outside city center. Red numbers are employment, by zip code, in thousands. Data from : http://www.capcog.org/information-clearinghouse/tabular-data/ Commute and Labor Sheds by Zip Code, 2007
Employment Density & Trip Purpose More Travis County Employment is in Low Density than High Density : 420,000 vs 80,000 Most trips are NOT work related : 82% vs 18% WORK From National Household Travel Survey
Trip Berg 4% H2W-HD 16% H2W-LD 80% Non Work : Shopping, School, Church, etc
CMT would be Cellular Circulator Routes would converge on each Transit Center
Van Pools • Unpaid driver labor • Lowest cost per rider • 150,000 working at large employers • 30,000 new riders if 20% use VP • 3000 vans, $ 75 million
Transit Center Near Shopping Center • Grocery & Drug Store • Child Care at Community Center (CC) • Bike lockers & Bike Rentals • Car Share
TC + CC + Shopping A working mom can accomplish three tasks on the bus trip home from work : • Get to home TC by express bus • Buy groceries • Pickup kid from day care. • Take Circulator Van back to apartment
“In California, there are already a dozen TODs with child care”
Express Grid Routes Run by Express bus Every 10 minutes Connect 30 Transit Centers
CirculatorWait Time By Zip CodeOFF-PEAK MAPYellow - van every 10-12 minutes. Orange - van every 5-9 minutes. Green- Bus with 44 seats every 10 min MetroCellMapV2.Dpp
Does Any City Use CMT ? Many cities use Bus Rapid Transit (BRT) Many cities use shared taxi CMT = BRT + Shared Taxi.
Shared Taxi Examples • Atlantic City, NJ • Capetown, South Africa • Peru, Turkey, Phillipines
Cape Town Train Station Minibus Taxi Boarding Area
A Taxi Van in Austin could be like the Sprinter Seats 14 + Wheel Chair High enough to stand in
Bus Rapid Transit (BRT) Increases Ridership 250% increase for Miami 200% increase for Honolulu 85% increase for Boston
BRT in Curitiba http://www.streetfilms.org/curitibas-brt/
Capital Costs Per Rider • $100,000 • $130,000 to $1,000,000 • $2,500 • $1,250 • $ 800 • Commuter Rail : • Urban Rail : • Van Pool : • Express Bus : • Taxi Van : Commuter Rail : $100 Million / 1000 riders = $100,000 per rider Urban Rail in 2020: $1.7 billion / 1,600 riders > $1,000,000 Urban Rail in 2030: $1.7 billion / 13,000 riders = $130,000
Bang for the Buck $130,000 will buy either : One new train rider OR 52 new riders using Van Pools OR 83 new riders using Circulator Vans
Connections with CMT and UR CMT would reach 90% of Homes And 90% of Jobs. Percentage of All Possible Home to Work Trips = .90 x .90 = .81 or 81% for CMT UR would reach 9% of Homes and 20% of Jobs. Percentage of All Possible Home to Work Trips = .09 x .20 = .018 or 1.8% for UR
High density TODS at TCs - Part 1 START UP • Pick shopping center with Grocery Store • Add day care by renting a store front, • Add waiting room for vans by renting • Add bicycle lock up room by renting LATER • Build Community Center • Build Transit Center
High density TODS at TCs – Part 2 • City Relaxes parking requirements • City Zones Circulator Routes for higher density commercial and residential Developers Build on Circulator Routes : • Apartments • Office Buildings
Conclusion CMT will : Increase ridership three fold Reduce travel time and wait time Get 80,000 cars off the road Save Working Poor $320 million a year Enable 240,000 people to live car free For more details visit : CMT4Austin.org
Express bus route would start at Kramer station, then stop at Crestview, Highland, UT and end at Convention Station Kramer Stn Crestview Stn Green line is express bus headed south. Brown line is bus headed north. Dashed red line is commuter rail. UT Station Convention Stn
Kramer Station Circulator Routes Routes During Peak Hours Routes are run by vans Blue dot is Kramer stn. Red dashed line is commuter rail
UT and CBD Circulator Routes
Low Cost Plan Annual Rent
Calculate Average Riders per Vehicle Trip in Typical Zip Code