Global Energy Use and Environmental Impact
Explore the significant variations in per capita energy consumption among countries from 1800 to 1990 and the rising trends in global temperature. Learn about the risks associated with old U.S. batteries sent to Mexico and the aftermath of nuclear disasters in Chernobyl and Three Mile Island.

Global Energy Use and Environmental Impact
E N D
Presentation Transcript
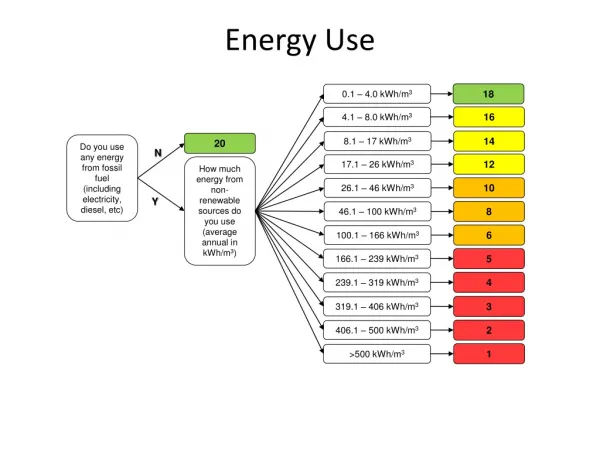
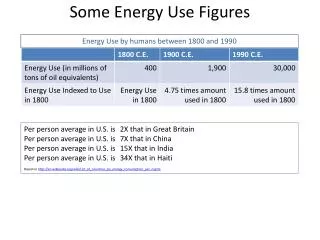
Some Energy Use Figures Energy Use by humans between 1800 and 1990 Per person average in U.S. is 2X that in Great Britain Per person average in U.S. is 7X that in China Per person average in U.S. is 15X that in India Per person average in U.S. is 34X that in Haiti Based on http://en.wikipedia.org/wiki/List_of_countries_by_energy_consumption_per_capita
Graph showing rise in global temperature from 1880 to present. Indexed to the mean global temperature for 1951-1980. Source: NASA GISS
Lead from Old U.S. Batteries Sent to Mexico Raises Risks (NY Times, 12/8/2011)
The Abandoned City of Pripyat with the Damaged Chernobyl Nuclear Plant in the Distance
President Jimmy Carter Leaving Damaged Three Mile Island Nuclear Power Plant