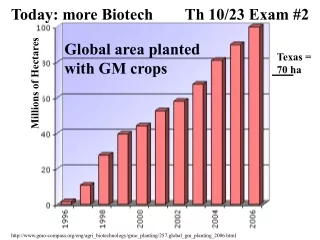
6 MILLIONS HECTARES
540 likes | 726 Vues
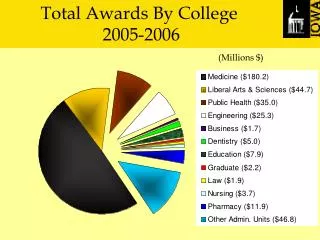
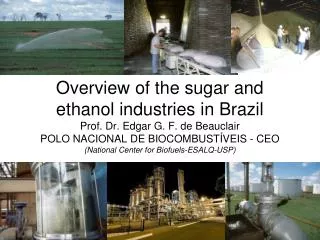
Overview of the sugar and ethanol industries in Brazil Prof. Dr. Edgar G. F. de Beauclair POLO NACIONAL DE BIOCOMBUSTÍVEIS - CEO (National Center for Biofuels-ESALQ-USP). Sugarcane in Brazil 2006/07. 6 MILLIONS HECTARES. 470 MILLIONS TONS OF CANE. 29 MILLIONS TONS OF SUGAR.

6 MILLIONS HECTARES
E N D
Presentation Transcript
Overview of the sugar and ethanol industries in BrazilProf. Dr. Edgar G. F. de BeauclairPOLO NACIONAL DE BIOCOMBUSTÍVEIS - CEO(National Center for Biofuels-ESALQ-USP)
Sugarcane in Brazil 2006/07 6 MILLIONS HECTARES 470 MILLIONS TONS OF CANE 29 MILLIONS TONS OF SUGAR 17 BILLIONS LITERS OF ETHANOL 83 TON. SUGARCANE/ha Fonte: Estimativas Nastari, 2007 Fonte: ORPLANA 2006
Sugarcane in São Paulo state, 2006/07 3 MILLIONS HECTARES 265 MILLIONS TONS OF CANE 19,5 MILLIONS TONS OF SUGAR 11 BILLIONS LITERS OF ETHANOL 90 TON. SUGARCANE/ha Source:UNICA. 2007 Source: IEA, 2008
% 100 80 86 60 55 40 14 45 Renewable 20 No Renewable 0 World Brazil BRAZILIAN ENERGY BASE Renewable sources 44.5 % Gilberto Ribeiro de Carvalho - PETROBRAS Fonte: MME, BEN 2006
Ethanol on Energetic Brazilian Matrix Fonte: UNICA, 2008.
BRAZILIAN ETHANOL PROGRAM 1975 – high oil import costs + low world sugar prices • Federal government promoted Ethanol production for blending-E20 • Credit guarantees and low interest loans for new distilleries • State trading enterprise began purchasing ethanol at high prices • A marketing program • Petrobras – ethanol distribution throughout the country RESULTS - Between 1975 and 1979, ethanol production increased more than 500%.
BRAZILIAN ETHANOL PROGRAM 1979 – Brazilian Government signed agreements with car companies for 100% ethanol powered cars RESULTS – Fiat, VW, MB,GM and Toyota produced 250,000 ethanol powered cars in 1980 350,000 in 1982 1985 – Troublesome period World oil prices dropped - reducing the benefit of replacing oil imports with ethanol. Brazil faced serious inflation problems and began a series of economic reforms. Differential price between ethanol and gasoline was eliminated. Differenciated loans for the construction of new distilleries were cut.
BRAZILIAN ETHANOL PROGRAM 1990 – Low profile for Brazil's ethanol program – Government required that all gasoline sold in Brazil contained E20% End of 1990´s – agreements among Brazilian government and auto manufacturers for development of flex fuel vehicles. 2001 – Government proposed a preferential tax for flex or ethanol fueled vehicles, a 14% sales tax, as compared to a 16% sales tax on non-ethanol fueled cars. RESULT - Ford launched the first flex fuel prototype in 2002, with VW following in 2003.
Cane: Carbon absorbing machine Fonte: Polo de Biocombustíveis, Esalq
Sugarcane areas in Brazil Amazon forest No industries in Acre Barralcool Pantanal wetlands Atlantic coast forest
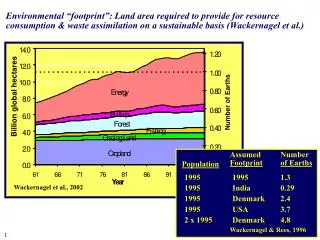
Areas for agriculture expansion in Brazil 106 millions hectares for agriculture
Ploweble Lands Nota: Area colhida em 2004. Fonte: FAO, Land Resource Potential and Constraints at Regional and Country Level (2000); FAO (2007). Elaborado pelo ICONE.
2010 / 2011 / 2012 / 2013 / 2014 / 2015 / 2016 / 2017 / 2018 / 2019 First year Second year Third year Forth year Fifth year Third crop Third crop Forth crop Second crop Second crop Second crop First crop First crop First crop First crop
2010 / 2011 / 2012 / 2013 / 2014 / 2015 / 2016 / 2017 / 2018 / 2019 Sixth year Seventh year Eighth year Ninth year Tenth year Third crop Third crop Third crop Third crop Third crop Forth crop Forth crop Forth crop Forth crop First crop First crop Forth crop First crop First crop First crop Second crop Second crop Second crop Second crop Second crop
Barralcool Mill – Barra do Bugres, MT – has 30,000 ha of sugarcane, capacity of 14,000 t/day of sugarcane. The first in Brazil to produce: sugar, ethanol, energy and biodiesel Biodiesel Plant
Brazilian plants Brazil has 357 plants that produces sugar, ethanol and some of them also produce electric energy using bagasse Untill 2010 will be installed more 88 mills: 19 in 2007/08; 36 in 2008/09; 33 in 2009/10 Total investment = US$ 17 billions
Moagem 2005 Moagem 2006 Moagem 2007 Moagem 2008 Moagem 2009 South Center Brazil´s sugarcane mills Fonte: CTC/UNICA
Sugar Cane Estimative Area in the State of São Paulo (2005 – 2015)
Estimate increase in Brazilian sugarcane production Milions of ton. 559 600 521 487 455 427 500 403 225 40% 217 42% 400 210 43% 203 45% 200 47% 198 49% 300 200 334 60% 304 58% 277 57% 252 55% 227 53% 205 51% 100 0 2005/06 2006/07 2007/08 2008/09 2009/10 2010/11 Increase of 30 millions t/year For sugar For Ethanol
Ethanol production costs and energy balance Retail Prices US$/gallon Gasoline $ 3.03 Ethanol corn USA – 4,9 billion gallons US production costs $ 1.09 per gallon Ethanol $2.62 Energy balance 1:1.3 $ 3.71 energy equivalent Gasoline (E25) $ 4.91 Ethanol sugarcane BRAZIL – 4 billion gallons BR production costs $ 0.87 per gallon Ethanol $ 2.92 Energy balance 1: 8 $ 3.88 energy equivalent Energy balance is the fossil fuel energy used to make fuel (input) compared with the energy in the fuel (output) Source: R. Covey, National Geographic, 2007
GHG EMISSIONS BY THE SECTOR • GHG emissions avoided by the sector in 2003 were as follows: • - for ethanol replacing gasoline: 27.5 million tons of CO2 equivalent • for cane bagasse replacing fossil fuel in sugar production: • 5.7 million tons of CO2 equivalent. For every additional 100 million tons of sugar-cane, 12.6 million tons of CO2 equivalent worth of emissions could be avoided over the next few years using ethanol, the bagasse and the additional electric power surplus.
GHG emissions for different types of ethanol Fonte: Macedo et. alii, 2004, UK DTI, 2003and USDA, 2004.
First Brazilian car fuelled by a blend of ethanol and gasoline - 1925 Ethanol
Ethanol uses in Brazil 40% of the fuel used in light vehicles 17 billions L / year 77% as fuel 5% in food and perfume industries, and ethanol derived chemicals, 18 % exported Anhydrous (99,9%) ethanol - to blend with gasoline (20 -25%) Gasoline C Hydrous (96%) ethanol - directly as fuel. – Flex Fueled vehicles
Ethanol exported from Brazil Fonte: Ministério da Agricultura
Industrial Fermentation Process Evolution Parameters 1977 2007 Fermentation gains 75 - 80% 90 - 92% Destilation gains 95% >99% Wine Contamination (n. bacteries) 108-109/mL 105-106/mL Fermentation time 18 - 22 h 6 - 10 h Yeast Recirculation ~70% >90% Yeast in the wine 4-6% 8-17%
Hydrolysis process Dedini´s prototype 5000L/day Concentrated acid Chemical hydrolysis Pre-treatment Diluted acid Enzymatic hydrolysis TECNOLOGIA DHR Organic solvent
ETHANOL PRODUCTION USING BAGASSE Potential for conversion of Bagasse in ethanol
New technologies for ethanol production Bagasse hydrolysis
Sugarcane energy x oil energy 150 kg of sugar ------ 2,400 MJ 140 kg of bagasse ------ 2,500 MJ 140 kg of straw ------ 2,500 MJ 1 ton sugarcane stalks 7,400 MJ 1 barrel oil 6,000 MJ 1 ton of sugarcane = 1,25 barrelof oil 85 tons sugarcane/ha = 630GJ / ha or 105 barrel of oil 470 millions tons sugarcane = 587 millions barrel of oil
Electric and Mechanical Energy generation Mills and distilleries also generated 11.3 TW of electric and mechanical power, most of it for self consumption. That is equivalent to 3% of the electric power consumed in the country. The use of bagasse as a fuel is equivalent to 20.2 M tons of oil
ENERGY from sugarcane biomass (MW/year) Energy used to produce sugar and ethanol 1.500 Energy excess, actually sold as electric energy 620 Energy potential – with actual technologies 6.000 a 8.000 New technologies and increasing areas of sugarcane (5-10 years) 15.000 a 22.000 Fonte: Aneel/Unica
Usina Santa Cândida / SP 32MW Fotos: Koblitz
MANUAL HARVESTING • Number of workers to cut cane manually: • 1.000.000.000 t (projection) • 6 t cane / man.day • 180 days / season • approximately 1000 t cane / man.season • Means 1.000.000 men cutting cane • Cane needs to be burned - Environmental • Lower yields, higher costs • or mechanization with less, but better jobs?
Manual harvesting 400 men cutting 10 bus drivers 40 machine operators 2,5 men shop support 12 controllers 18 cane truck drivers 482 total men 10 bus; 5 loaders; 5 tractors. US$ 6,56 / t Mechanical harvest 12 operators 24 tractor operators 9 mechanics / support 12 cane truck drivers 9 controllers 66 total men 4 harvesters; 4 tractors; 8 wagons; 1 bus. US$ 4,08 / t Social Impact – 3200 t / day