RBAEF Project: Biomass for Sustainable Energy Future
410 likes | 507 Vues
Explore the critical role of biomass in achieving a sustainable energy future through the RBAEF project. This project aims to evaluate biomass energy pathways, policy options, and transition dynamics to accelerate the adoption of biomass for energy services. Key emphasis is placed on mature technology and environmental evaluations to determine biomass resource sufficiency and transition dynamics. The project, involving multiple institutions, seeks to identify paths for biomass energy use and realize associated benefits in a timely manner.

RBAEF Project: Biomass for Sustainable Energy Future
E N D
Presentation Transcript
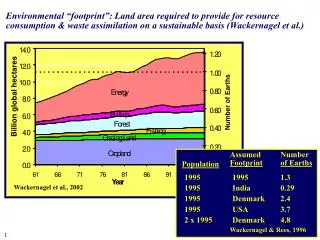
1 4 . 0 1 . 2 0 1 2 . 0 1 . 0 0 1 0 . 0 0 . 8 0 E n e r g y Billion global hectares 8 . 0 Number of Earths 0 . 6 0 B u i l t - u p 6 . 0 F o r e s t 0 . 4 0 F i s h i n g 4 . 0 r G a z i n g L a n d 0 . 2 0 2 . 0 C r o p l a n d Assumed Footprint Number of Earths 0 . 0 . 0 0 0 Population 6 1 6 6 7 1 7 6 8 1 8 6 9 1 9 6 1995 1995 1.3 r Y e a Wackernagel et al., 2002 1995 India 0.29 1995 Denmark 2.4 1995 USA 3.7 2 x 1995 Wackernagel & Rees, 1996 Denmark 4.8 Environmental “footprint”: Land area required to provide for resource consumption & waste assimilation on a sustainable basis (Wackernagel et al.)
The Next Industrial Revolution?* Context Resources plentiful, people scarce Response Dramatic increases in Labor productivity (output/person/hour); 100-fold higher Fraction of energy supply from non-sustainable sources (~0 to 80% higher) Resource consumption per capita Population Level of services (mobility, housing, dietary variety, information) desired Context Resources scarce, people plentiful Response Population stabilization (appears to be happening) Dramatic increases in Resource productivity (service/resource invested) Fraction of energy supply from sustainable resources The first industrial revolution The second industrial revolution *Hawkins, Lovins, and Lovins, “Natural Capitalism”
Imagining a Sustainable World Secondary Intermediates Human Needs Sustainable Resources Primary Intermediates Sunlight Animals Food Energy Wind Organic Fuels Motors/ Lights Ocean/hydro Heat Biomass Transport. Geothermal Materials Hydrogen Nuclear Organic Electricity Batteries Minerals Inorganic The Environment Nutrient cycles Wildlife habitat/ biodiversity Air Water Soil Climate Sole Supply Choices
• RBAEF Project • Life cycle issues - a product non-specific framework for analyzing fossil fuel displacement • Resource issues - matching the scale of challenges & solutions • RBAEF Mature Technology Scenarios Prospects for Achieving Large Sustainability & Security Benefits via Biomass-Based Processes Lee Lynd Thayer School of Engineering Dartmouth College Workshop on the Economic and Environmental Impacts of Bio-Based Production Chicago, Illinois June 8, 2004
Sponsors • Department of Energy • The Energy Foundation • National Commission on Energy Policy Objectives Identify & evaluate paths by which biomass can make a large contribution to future demand for energy services. Determine what can be done to accelerate biomass energy use and in what timeframe associated benefits can be realized. The Role of Biomass in America’s Energy Future (RBAEF) Project Multi-institutional • Dartmouth • Natural Resources Defense Council • Argonne National Lab • Michigan State University • National Renewable Energy Lab • Princeton • Union of Concerned Scientists • USDA Agricultural Research Service • University of Tennessee • Oak Ridge National Lab
The Role of Biomass in America’s Energy Future (RBAEF) Project… Task Task 1. Biomass production a. Technology analysis b. Environmental evaluation Tasks 2&3. Biomass power & biofuels a. Technology analysis b. Mobility chains c. Environmental evaluation Task 4. Coproduct analysis a. Technology analysis b. Environmental evaluation Task 5. Biomass Resource Sufficiency a. Sufficiency analysis b. Environmental evaluation Task 6. Transition Dynamics Task 7. Policy Options & Evaluation a. Policy Development b. Policy Evaluation Group Leader Sandy McLaughlin (formerly of ORNL) Nathanael Greene, NRDC Eric Larson, Princeton; Lee Lynd, Dartmouth Michael Wang, ANL Nathanael Greene, NRDC Mark Laser, Dartmouth; Bruce Dale, MSU Nathanael Greene, NRDC Lee Lynd, Dartmouth Nathanael Greene, NRDC John Sheehan, NREL Nathanael Greene, NRDC Nathanael Greene, NRDC
Diversity of participants • Technical • Policy • Environmental Emphasis on mature technology More important to know where we can get than where we are to evaluate • The potential contribution of biomass to a sustainable world. • Appropriate levels of research effort, policy intensity for biomass-based options. Analysis of biomass energy within a framework that assumes innovation & change can happen. Key Premise: Rational policy formulation is informed by a vision of what is possible. The Role of Biomass in America’s Energy Future (RBAEF) Project… Distinguishing features Breadth of technologies (although not all) considered in a common framework.
• Net fossil fuel displacement (kg FFE displaced/kg product) Life Cycle Issues > 1: large benefits < 0: no benefit One figure of merit • Seek to develop a product non-specific framework to glean general insights Whether large (per unit) fossil fuel displacement can be achieved Upon what this depends
LCA Framework for analysis of biologically-based processes Process Activation (wet milling, pretreatment, hydrolysis, gasification) Primary Product Biomass Production Biological Conversion Product Recovery Utilities & Residue Processing Coproducts & Treated Effluents PA PF PPR Energy Supply Of the parameters A, PA, PF, PPR, C, and hD, only PPR exhibits a strong functional dependence on the product made. D A C
Fossil fuel displacement: Most of the story N-PR = net fossil energy input exclusive of product recovery (kg FFE/kg FC) Utility of DP* (benefits of approximation) Gain general insights into the importance of feedstock & process features Fossil fuel displacement: The whole story D= product displacement efficiency (kg FFE/kg primary product) N = net fossil fuel input (kg FFE/kg fermentable carbohydrate) YP/FC = product yield (kg primary product/kg fermentable carbohydrate) Screen processes in the absence of product-specific information Rapidly incorporate product-specific information into an existing rubric
Summary of S cenarios and C orresponding P arameter V alues kg FFE/kg biomass (A, PA , C); kg FFE/kg FC (PF, N-PR) Scenario A P P N C A F PR - Corn 1. Aerobic, no residue utilization 0.06 48 0.0943 0.238 0.0308 0.403 (0% stover used) 2. Aerobic, current rotation 0.0648 0.0943 0.238 0.11 9 0.280 (13% stover used) 3. Aerobic, high recovery 0.0648 0.0943 0.238 0.248 0.123 (46% stover used) 4. Anaerobic, no residue utilization 0.0648 0.0943 0.0527 0.0308 0.218 (0% stover used) 5. Anaerobic, current rotation 0.0648 0.0943 0.0527 0.119 0.104 (13% stover used) 6. Anaerobic, high recovery 0.0648 0.0943 0.0527 0.248 - 0.062 (46% stover used) Cellulosic 1. Aerobic, base case 0.0190 0 0.192 0.0849 0.0784 2. A erobic, advanced 0.0190 0 0.192 0.114 0.0613 3. A naerobic, base case 0.0190 0 0.0071 0.0849 - 0.107 4. A naerobic, advanced 0.0190 0 0.0071 0.114 -0.124 Lynd & Wang (JIE 04).
EtOH, hD = 0.78, with product recovery PHA, hD = 1, with product recovery Corn Cellulosic 2.5 2.5 2 2 4 1.5 1.5 6 3 (kg FFE/kg product) 1 1 2 5 0.5 0.5 1 0 0 2 p 1 4 -0.5 -0.5 * or D -1 -1 3 p D -1.5 -1.5 0 0.2 0.4 0.6 0.8 1 0 0.2 0.4 0.6 0.8 1 Y Y P/FC P/FC 1. Aerobic, base case 1. Aerobic, no stover utilization (0%) 2. Aerobic, advanced 2. Aerobic, current rotation (13%) 3. Anaerobic, base case 3. Aerobic, high recovery (46%) 4. Anaerobic, advanced 4. Anaerobic, no stover utilization (0%) 5. Anaerobic, current rotation (13%) 6. Anaerobic, high recovery (46%) Numbers in parenthesis refer to % corn stover utilized
Fostered by Feedstock Cellulosic Corn with residue recovery and compatible harvest methods Process High product yield Anaerobic rather than aerobic processing Reasonable energy requirements for product recovery Fossil Fuel Displacement via Biologically-Based Processes (kg fossil fuel/kg product) Can be very high if most of these features are favorable Can be zero or negative if most of these features are not favorable Processes can be rapidly screened in the absence of detailed, product-specific analysis
Resource Issues • Origin of sustainability & security challenges What do we need to impact? • How big a role could biomass play in meeting these challenges? Matching the scale of challenges & solutions
2,000 60 1,747 51 Energy (MM Short Ton) 50 Energy (Quad BTU) 1,500 Non-Energy (MM Short Ton) Non-Energy (Quad BTU) 40 1,081 23 [16 LDV; 7 other] 666 [459 LDV; 207 other] 27 1,000 30 20 570 505 20 347 500 8 10 6 68 2 35 1 0 0 Animal Feed Transportation Fuels Net Petroleum Imports Fossil Fuel for Electricity + Transportation Fossil Fuel for Electricity Lumber, Pulp, and Plywood Annual Growth in Fossil Fuels Organic Chemicals and Polymers • Notes: • Crude density ≈ 7.33 barrels/metric ton; natural gas density ≈ 48,700 ft3/metric ton; crude LHV ≈ 127,000 BTU/gal • “Other transportation” category includes: HDVs, airplanes, freight trains, public transit, water shipping • Annual fossil fuel growth = average from 1992 to 2002 • Animal feed mass expressed in units of corn equivalents; corn kernel LHV ≈ 8,000 BTU/lb • Timber products LHV ≈ 8,000 BTU/lb • Organic chemicals LHV (ave) ≈ 18,000 BTU/lb • Primary organics include ethylene, propylene, methanol, benzene, toluene, 1,3-butadiene, and o-xylene • Primary organic chemicals used as polymer feedstock ≈ 46 MM ton/yr (assumes stoichiometric yields) • Sources: • Fossil fuels: 2002 data, EIA • Transportation fuels: 2001 data, BTS • Animal feed: 2002 data, USDA-NASS • Timber products: 2002 data, USDA-NASS • Organic Chemicals: 2000 data, C&EN, CMR • Polymers: 2003 data, APC Market Sizes for Categories of Products Potentially Derived from Biomass Annual U.S. Consumption (millions of short tons) (Quadrillion BTU/yr)
Biomass - A Credible Solution to Mega Challenges? If this were to change Would provide a rationale for shifting into a new gear. Our major sustainability & security challenges arise primarily from energy use Sustainability: Fossil fuel utilization in all sectors Security: Oil the dominant concern, transportation the dominant sector If biomass is to play more than a minor role in responding to sustainability & security challenges, it must have a significant impact on energy utilization. Case has not been articulated in any detail Widely-accepted common wisdom: No. Not enough biomass/land
Approaches to Energy Planning & Analysis 1. Bury our heads in the sand. Pretend that energy challenges are not real or will go away. 2. Extrapolate current trends. Often championed by “realists”. 3. Hope for a miracle. Acknowledge the importance of sustainable and secure energy supplies, but dismiss foreseeable options as inadequate to provide for the world’s energy needs & calls for “disruptive” advances in entirely new technologies. 4. Innovate & change. Define sustainable futures based on mature but foreseeable technologies in combination with an assumed willingness of society to change in ways that increase resource utilization efficiency. Then work back from such futures to articulate transition paths that begin where we are now. #1 and #2 do not offer solutions to sustainability and security challenges. #3 should be pursued but is too risky to rely on. #4 is the most sensible choice if it is assumed that problems associated with sustainability and security are important to solve.
Radically different conclusions have been reached How big a contribution could biomass make? • Biomass becomes the largest energy source supporting humankind in the Renewables-Intensive Global Energy Scenario of Johanssen et al. (1993). • Biomass share of world energy supply will equal that of oil in 2050 and be as large as any other resource (Kassler, Shell Petroleum Ltd, 1994). • Biomass will eventually provide over 90% of U.S. chemical and over 50% of U.S. fuel production (Biobased Industrial Products, NRC, 1999). • To provide ethanol to replace all gasoline used in the[U.S] light-duty fleet, we estimate it would be necessary to process the biomass growing on 300 to 500 million acres. (Lave et al., 2002). • Large scale biofuel production is not an alternative to the current use of oil and is not even an advisable option to cover a significant fraction of it (Giampetro et al., ‘97). Key variables impacting availability of biomass for non-food uses Biomass productivity (tons/acre*yr) Vehicle efficiency (miles/gallon) Land use Food production efficiency (calories, protein/acre) Integrated production of feedstock production into existing activities (ag., forest products)
Cellulosic biomass (Pimentel group) Switchgrass or short rotation forestry, simulated commercial ave., now Corn kernels, US ave. Switchgrass, projected 20-30 yr ave. Corn - above-ground, US ave. Switchgrass, mature Biomass Productivity 12 10 22 8 Productivity (tons/acre*yr) 6 Productivity (Mg/ha*yr) 11 4 2 Future productivity important for evaluating feasibility of large-scale bioenergy Relatively little effort put into development of high-productivity crops, cropping systems for cellulosic biomass If increasing the BTU productivity of cellulosic energy crops received an effort comparable to that invested in increasing the productivity of corn kernels, what would be reasonable to expect?
Land Area Required for Current U.S. Light Duty Mobility in Relation to Vehicle Efficiency •LDV VMT = 2.5 trillion vehicle miles traveled •Waste availability: 200 million dry tons •Switchgrass productivity: 10 dry tons/acre/year (20 to 30 year projected average, tentative) •Fuel yield: 100 gallons/dry ton
High Vehicle Efficiency Possible (2020 estimates from Friedman, 2003) Today: ‘04 Prius (mid-size), 56 mpg By 2020, fuel savings > added vehicle cost (hybrids + advanced technology) Fleet average: 50 to 60 mpg. A fleet made up only of pickups, minivans, and SUVs could still reach 50 mpg. Desirable Direct: Reduces GHG emissions, oil imports & depletion rate. Indirect: Increases the feasibility of alternatives to petroleum Difficult to imagine a sustainable transportation sector without it Scenario High efficiency vehicles compensate for… Renewable power/H2Otherwise low travel radius Renewable power/batteriesOtherwise low travel radius Biomass/fuel (several)Otherwise large land requirement Implicit in transportation scenarios featuring energy storage as H2
Food Production Efficiency: Some Observations Strongly impacted by dietary trends - the amount and kind of meat consumed in particular. Tremendous potential elasticity Land to feed U.S. population in the most land-efficient way possible:~ 20 million acres Land currently used:> 400 million acres Food production is usually assumed to remain static in analyses of the role of biomass as an energy source. However, demand for cellulosic feedstocks due to cost-competitive processing technology would very likely result in large changes in food production. Farmers would rethink what they plant. Coproduction of processing feedstock and animal feed is one likely change. A similar argument can be advanced for the forest products industry.
Concept Feed Protein Fuels/ Chemicals Switchgrass Protein Recovery/ (& Pretreatment) Composition & productivity comparison Crop Mass Productivity (tons/acre/year) Protein (Mass Fraction) Protein Productivity (tons/acre/year) Switchgrass 5.0 – 10 .08 -0.12 (early cut) 0.4 – 1.2 Soybeans 1.1 – 1.3 0.36 (bean only) 0.40 – 0.45 • Consumption of calories and protein by livestock 10x that by humans in the U.S. • Production of perennial grass could potentially produce the same amount of feed protein per acre while producing a large amount of feedstock for energy production • Requires readily foreseeable processing technology to recover feed protein Integrated Production of Processing Feedstocks and Feed Protein Processing
1 . Vehicle Efficiency 1 . Conversion Efficiency 1 . Ag. Productivity 1 . Nutritional Productivity Driving habits, demography Allowance for residues Distributional losses Calories, protein per person Sustainable land base, w/ allowance for nature The Availability of Biomass for Non-Food Uses is a Much More Elastic Quantity Than Usually Assumed Land Required to Meet a Specified Need (e.g. Transportation) Land Available Would like to know: = Population x mi/person x energy/mile x ton biomass/energy x (1 - fresidues) x acres/ton Available land - Population x 1/hdistribution x nutrition/person x acres/nutrition Considering the range of values these largely independent parameters might be assumed to take in a future scenario (e.g. several decades hence): = 1.5-fold x 3-fold x 4-fold x 2-fold x 2-fold x 5-fold = 320-fold . 3-fold - 2-fold x 1.5-fold x 1.5-fold > 5-fold 3-fold - 20-fold
Calibration points Total U.S. cropland: ~400 million acres (162 million ha) Land planted in soybeans: ~74 million acres (30 million ha) Idled cropland in conservation reserve program: ~30 million acres (12 million ha) Land required to satisfy current U.S. LDV mobility (~2/3 of total transport energy) Biomass Productivity tons/acre*year [Mg/ha*yr] Integrated Feed/Feedstock Coproduction Additional Land* Million Acres [ha] Fleet mpg Scenario a. Status quo5 [11] 20 No360** [146] * Land in addition to current cropland. **(2.5x10¹² mi/yr)*(1 gal gas/20 mi)*(0.0144 ton biomass/gal gas equiv.)*(1 acre*yr/5 ton) = 360 x 106 acres Sample calculation for ton biomass/gal gas equivalent: (1.55 gal EtOH/gal gas)*(1 ton biomass/108 gal EtOH) = 0.0144 ton/gal gas equiv. Similar values are obtained for other biomass-derived fuels Biomass Resource Sufficiency (the short version) b. High productivity10 [22]20 No180 [73] c. (b + high mileage)10 [22] 55No72 [29] d. “Motivated”10 [22] 55 Yes Near zero
Biological processing Ammonia fiber explosion pretreatment Consolidated bioprocessing (no dedicated step for cellulase production) Energy-efficient distillation (intermediate vapor recompression heat pumps) Extensive water recycle Thermochemical processing Pressurized oxygen-blown gasifier Warm gas clean-up, integrated tar cracking Power generation via combined cycle gas turbine Features of RBAEF Mature Technology Scenarios Feedstock production Switchgrass @ 22 Mg/Ha*yr (10 tons/acre*year); 2x current average Follow-on work on other feedstocks to be proposed 5000 Mg/day (14% of land in a 25 mile radius)
Hazards of driving with the low beams on We seek to view the future with the high beams on…
Hazards of driving with the low beams on We seek to view the future with the high beams on… while avoiding invalid comparison
13% Process Steam Complementarity of Biological & Thermochemical Processing Ethanol Production 41% Residues 100% (Biomass LHV) Pretreatment 3% Process Power Biological Conversion Separation 99% 98% 56% Ethanol In-progress analysis, numbers not finalized & may change.
Complementarity of Biological & Thermochemical Processing DME Production 25% DME 100% Biomass Gasification Gas Clean-Up DME Synthesis & Distillation GTCC Power 85% 85% 50% Waste Heat 25% Power In-progress analysis, numbers not finalized & may change.
DME Production Ethanol Production 11% DME 13% Process Steam 41% Residues 41% Residues Gas Clean-Up Gasification DME Synthesis & Distillation GTCC Power 35% 35% 100% (Biomass LHV) Pretreatment 3% Process Power Biological Conversion Separation 99% 98% 5% Power 56% Ethanol Complementarity of Biological & Thermochemical Processing In-progress analysis, numbers not finalized & may change.
Energy Output:Input Ratios Increase with Maturity 100% 90% 80% 70% 60% 50% 40% 30% 20% 10% 0% 10% 20% 30% 40% 50% AFEX CBP No evaporation GTCC Power IHOSR Distillation Integrated Steam Drying of Residue % of Feedstock LHV External Energy Input Internal Energy Input Energy Output Adv. Ethanol (B)/ Steam drying/GTCC Adv. Ethanol (B)/ Steam drying/FT fuels Current Cellulosic Ethanol Oil Refining Corn Ethanol Adv. Ethanol (A)/ Rankine Power Adv. Ethanol (B)/ Rankine Power Adv. Ethanol (B)/ GTCC Power Adv. Ethanol/ H2 Energy Output Energy Input In-progress analysis, numbers not finalized & may change.
100% 88% 90% 80% 80% 74% 75% 72% 70% 5% 60% 18% 19% 11% 24% 60% 52% 50% 50% 4% Ethanol 25% 40% Electricity 30% 56% 56% 56% 56% TCF 20% 48% Hydrogen 25% 10% 50% EtOH + Power EtOH + FT fuels H2 EtOH + H2 EtOH + DME Petroleum Refining FT liquids + Power DME + Power Power Gasoline (38%) Diesel (21%) Jet Fuel (9%) Residual Fuel Oil (5%) Coke (4%) Still Gas (4%) Liquefied Gases (3%) Chemical Feedstocks (2%) • Sources: • Overall petroleum refinery efficiency: GM, ANL, BP, ExxonMobil, Shell, 2001. • Petroleum product yields: API • Product energy densities: EIA Other (2%) Co-Production Process Efficiencies Energy Yield (% of feedstock LHV) In-progress analysis, numbers not finalized & may change.
120% (HDF, Vehicular) 100% 100% 100 LDV 90 Electricity 80 77% (HDF, Total) HDV 70 60 45% 50 40 30 20 10 LDF + HDF + (FT liquids) EtOH (LDF) + Power • Electricity (from fossil and nuclear)/LDF: 0.73 [11.9 quad BTU/16.2 quad BTU ] • Total HDF (and other)/Total LDF: 0.45 [7.3 quad BTU/16.2 quad BTU ] • Vehicular HDF/Total LDF: 0.29 [4.6 quad BTU/16.2 quad BTU] Potential for Multi-Sector Impact Percent of Demand Displacement (Assuming 100% LDV Displacement) In-progress analysis, numbers not finalized & may change.
Switchgrass (10 tpa 2-cut) Ethanol ($0.10/lb) $1,216 Electricity ($0.04/kwh) Switchgrass (10 tpa 1-cut) Protein ($0.33/lb) $936 Oil ($0.27/lb, corn; $0.33/lb, soy) Switchgrass (5 tpa 2-cut) HFCS ($0.13/lb) $608 Dextrose ($0.20/lb) Switchgrass (5 tpa, 1-cut) $468 Corn Starch ($0.13/lb) Corn + Stover $873 Corn Gluten Feed ($0.03/lb) Corn Gluten Meal ($0.12/lb) Corn $754 Soybeans $374 $0 $1,000 $1,500 $500 Product Value per Acre Product Value ($/Acre) • Notes: • Switchgrass protein recovery assumed to be 80% • 2-cut switchgrass assumes 67% of total yield harvested in early cut • Corn + stover scenario assumes 50% stover collected • Ethanol price assumed to be $0.64/gallon (energy equivalent of gasoline at $1.00/gallon) • Sources: • Corn yield: 2002 U.S. average, USDA-NASS • Corn product yields: CRA • HCFS, glucose, and dextrose prices: 2003 U.S. average, Milling & Baking News • Starch, CGF, CGM prices: 2002 average, USDA Feed Situation and Outlook Yearbook, 2003 • Corn oil price: 2002 average, USDA Oil Crops Situation and Outlook, 2003 • Soybean yield: 2002 U.S. average, USDA—NASS • Soy product yields: 2002 U.S. average, USDA Oil Crops Situation and Outlook, 2003 • Soy oil and protein prices: March 2004, Chicago Board of Trade In-progress analysis, numbers not finalized & may change.
Atmospheric CO2 2.47 3.09 0.42 Soil 6.56 Ethanol TCF (sequestered, 27%) (avoided, 56.3%) 5.56 Ethanol Photosynthesis Conversion End Use 2.05 Power X X 0.43 (avoided, 2.08 5.1%) 0.19 1.0 Fossil Carbon Reservoir X TCF Power (avoided, 11.5%) Soil Carbon Reservoir Carbon cycle for switchgrass processing (carbon-poor soil, 30 year period) Flows are tonnes of carbon per hectare per year Soil carbon: McLaughlin et al., 2002 Processing: In-progress RBAEF analysis In-progress analysis, numbers not finalized, may change.
But is taking a close and fresh look, and revising their assessment… Joint NRDC, UCS statement at the Feb. ‘04 public meeting of the RBAEF project “Cellulosic ethanol is at least as likely as hydrogen to be an energy carrier of choice for a sustainable transportation sector.” Finding Common Interest with the Environmental Community Two of the largest environmental advocacy organizations are involved Natural Resources Defense Council - Nathanael Greene Union of Concerned Scientists - Jason Mark The environmental community has generally been largely ambivalent relative to biomass energy and biobased industrial products.
An Evolving Vision for Long-Term Impact Nathanael Greene, NRDC (Draft) 350 300 250 200 Billions of Gallons of Gasoline Equiv. 150 100 50 0 2005 2010 2015 2020 2025 2030 2035 2040 2045 2050 Savings due to efficiency Cellulosic ethanol Gasoline Incorporates: UCS Aggressive MPG Increase Scenario Does not incorporate: VMT reduction
Life Cycle Issues (Benefits/Unit) Resource Issues (Units) Challenging, even with positive per acre effects • Very large fossil fuel displacement can be achieved by some biomass-based products • A product non-specific framework identifies feedstock, process, product features that foster this outcome • Near zero net greenhouse gas emissions for many bioenergy scenarios • Requires innovation & change, efficient resource utilization Perennial grass compared to row crops Crops & feedstock production • 100-fold less erosion Processing • 7 to 10-fold less herbicides, pesticides Utilization (vehicles) Agricultural integration • Much higher nutrient capture efficiency • Increased organic matter, soil fertility even w/ aggressive harvest • Potential for N recycle • Very large fractions of LDV & HDV mobility requirements could be met from biomass within existing ag land base … not the path we are on but the only sensible way to pursue a sustainable & secure future