Download
1 / 10
100 likes | 213 Vues
This case study explores the probability of successfully completing a 1,000-mile road trip under varying risk scenarios. We consider three drivers with different risk profiles: a high-risk taker without a spare tire, a time-sensitive driver who has a spare but lacks repair stops, and a prudent driver who carries a spare and repairs flats immediately. Utilizing Monte Carlo simulations and speed limits, we assess expected flat tire occurrences, trip completion probabilities, and significant delays. The findings highlight the importance of risk management and critical data assessment in planning road trips.

E N D
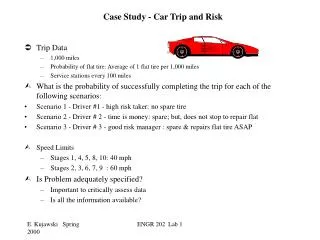
Case Study - Car Trip and Risk • Trip Data • 1,000 miles • Probability of flat tire: Average of 1 flat tire per 1,000 miles • Service stations every 100 miles • What is the probability of successfully completing the trip for each of the following scenarios: • Scenario 1 - Driver #1 - high risk taker: no spare tire • Scenario 2 - Driver # 2 - time is money: spare; but, does not stop to repair flat • Scenario 3 - Driver # 3 - good risk manager : spare & repairs flat tire ASAP • Speed Limits • Stages 1, 4, 5, 8, 10: 40 mph • Stages 2, 3, 6, 7, 9 : 60 mph • Is Problem adequately specified? • Important to critically assess data • Is all the information available? ENGR 202 Lab 1
Questions • What is the probability of completing the trip without help? • How many flat tires do you expect? • How long should it take to complete the trip? ENGR 202 Lab 1
How Good Is Your Intuition? • Assume you can drive at the speed limit and no car failures • What is the average speed? • How long will the trip take? • How many flat tires can you expect? • If you have a spare and fix flat ASAP, are you guaranteed to successfully complete trip? • What are the best and worse times for each driver? • How would you rank the risks for each driver? ENGR 202 Lab 1
Additional Necessary Data • Estimation of Potential Delays - Expert opinion ENGR 202 Lab 1
How To Solve Problem? • Common sense • Expert Opinion • Monte Carlo simulation using Excel ENGR 202 Lab 1
Common Sense Solution • 1.0 Best time with no speed violation • 1.1 Assume no flat tire • Min Time, hr: 20.83 • 1.2 Assume 1 flat tire • Driver 1 : 22.83 hrs Optimistic - 2 hrs for repair • Driver 2 : 21.17 hrs 1/3 hr to replace flat • Driver 3 : 21.83 hrs 1 hr to replace & repair flat • Typical PM: I can do trip in 22 hrs; I have slack of 1 hour • What is the PM’s probability of success? • Use Monte Carlo simulation ENGR 202 Lab 1
Monte Carlo Simulation • Developed during Manhattan Project in 1940’s • Each uncertain input parameter is modeled as random variable using a probability distribution for outcome Vs. probability • Run computational model multiple times with each input sampled according to its distribution • Analysis shows the distribution of possible outcomes • Many commercial packages available as add-ins to standard spreadsheets such as Excel • @Risk, Crystal Ball, SIM.xla • Gaining popularity in diverse area • logistics, risk management, decision analysis, marketing, strategy • Basic steps • Build a model of the uncertain situation • Specify the distribution functions • Run the simulation and analyze the results ENGR 202 Lab 1
What Are Random Numbers? • Random numbers (RN)= Uncertain numbers • Usually interested in RNs that satisfy well-known idealized distributions • uniform, discrete, poisson, triangular,…. • Distributions have statistical properties such as mean, mode, median, standard deviation,… • Representation of distributions • Curves, histograms, tables • Cumulative distribution • Prob(random variable X <= a) • Prob(random variable X <= max) =1 ENGR 202 Lab 1
How To Generate Random Numbers • How can one generate random integers uniformly distributed between 1 and 51? • Mechanical spinning wheel, 51 pieces of papers, software,... • Rand() in Excel generates #’s between 0 and 1 from a uniform distribution • But, we are interested in simulating random numbers having a specified distribution • Many techniques available • But, there are easier ways than programming yourself • Many PC tools available: SIM.xla, @Risk, Cristal Ball,… • Understand the difference between the statistical distribution functions and the RN generating functions ENGR 202 Lab 1
Car Trip - Lessons Learned • Understand the limitations of any model & assumptions • FR independent of trip distance • All tires are good at start • Tires fail independently; no common cause failures • How would the scenario be changed if part of the road is extremely bad? • Monte Carlo simulation captures the uncertainty aspects of the problem • MC captures the possible outcomes • MC averages are consistent with the closed form solutions, if possible • MC provides additional information about shape or distribution of outcomes • More general; but, requires more numerical modeling and computations • Excel is a powerful analysis tool when used properly! ENGR 202 Lab 1