Download

1 / 25
250 likes | 343 Vues
Collaborative research on creating synthetic populations at the sub-regional level for analyzing local socio-economic characteristics using innovative methods like IPF/Raking and GREGWT.

E N D
Creating synthetic sub-regional baseline populations Dr Paul Williamson Dept. of Geography University of Liverpool Collaborators: Robert Tanton (NATSEM, Australia) Ludi Simpson (CCSR, UK) Maja Zaloznik (Liverpool, UK)
Local area microdata containing local-area distributions [eg. smoking by income by sub-region] 1. Context • What do we want?? b) What have we got?
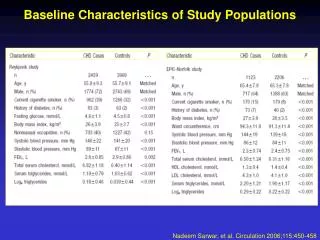
nd SAR District: Leeds (2 largest in UK) 95% Count % Confidence Economic position Female Total female Interval Employee full - time 1525 4146 36.8 ±1.5 On a Govt scheme 31 77 40.3 ±11.0 Unemployed 168 573 29.3 ±3.7 Retired 12 67 2116 59.9 ±2.1 52.9 Total 5545 10485 ±1.0 Over-exaggerate problem? • Large-scale survey • 2% sample • Minimally multivariate • Not based on minorities (e.g. unemployed ethnic minority) • Min. geog. threshold: 120k • Decadal
Local income distribution Survey distribution [smoking x income] Local smoking distribution Solution Reweight survey data... ...BUT weighting DOWN instead of up Synthetic microdata
2. IPF (Raking) Understanding IPF… N.B. IPF = Raking = IPF Q.What is IPF/Raking doing? A. Preserving the Odds ratios ...
3. Combinatorial Optimisation Male Female TARGET: 5 5 Young 2 Old 8 • Guided incremental weight adjustment
Comparison for margin-constrained tables • Target: age x sex x tenure x economic position (64 counts) at district level (17 districts) % NFC (17 district average) 32 37 22 18 • 2% SAR • IPFU • IPFN • CO
Simpson & Tranmer (2005) • Target: Car ownership (2) x Tenure (3) (6 counts; 3%s) for residents at ward level
Fit toconstraint variables (74 counts): GREGWT ‘convergent’ SLAs in NSW: Fit toconstraint variables (74 counts): GREGWT ‘NON-convergent’ SLAs in NSW
Fit tomargin-constrained distribution (household income x mortgage/rent): GREGWT ‘convergent’ SLAs
UNIVARIATEconstraints (158 constrained counts)
BIVARIATEconstraints (586 constrained counts)
Local socio-economics Survey data [District-level socio-demographics] Estimated GP Patient socio-economic characteristics Estimated HE Student socio-economic characteristics GP Patient age, sex, location HE Student age, sex, location 8. Conclusion (a) Accuracy of estimates (fitness for purpose?) (b) Unanswered questions (c) Applications in the real world…