API ANSI RP 754
281 likes | 707 Vues
API ANSI RP 754. Implementation Conference Call September 26, 2011. Purpose of RP 754 Conference Calls. To drive broad adoption of API 754 throughout the Refining and Petrochemical industries

API ANSI RP 754
E N D
Presentation Transcript
API ANSI RP 754 Implementation Conference Call September 26, 2011
Purpose of RP 754 Conference Calls • To drive broad adoption of API 754 throughout the Refining and Petrochemical industries • To drive consistency in Tier 1 and 2 metrics reporting in order to establish credibility and validity • To share learning's regarding the effective implementation of Tier 3 and 4 leading metrics 2
API (US Refining only): 17 companies reported 76 refineries NPRA (US Refining only): 39 companies reported 107 refineries 2010 PSE Data Collection - Overview • Both API and NPRA are collecting RP 754 data • You do not have to be an API or NPRA member to submit RP 754 data and receive their report • Refineries and petrochemicals may submit data • Only those submitting data receive the report • 2010 statistics:
2010 PSE Data Collection - Conclusions • Both API and NPRA 2010 PSE data reports are now issued. • The “PSE Rates” are different because there are two different data populations. • Proceed with caution when using these industry PSE rate numbers for internal benchmarking purposes for a few years until data consistency and validity is deemed sufficient. Goal is to make a US Refining industry-aggregated “PSE Rate” publically available in 2013.
Data Inconsistencies in 2010 submittals • Three areas from the 2010 data collection require further education to ensure data consistency: • PRD Discharges • Contractor hours • Consequences
Data Inconsistencies – PRD Discharges Two ways to have a PSE involving a PRD (Pressure Relief Device): • A LOPC from a PRD that results in: • an employee, contractor or subcontractor “days away from work” injury and/or fatality; or • a hospital admission and/or fatality of a third-party; or • an officially declared community evacuation or community shelter-in-place; or • a fire or explosion resulting in greater than or equal to $25,000 of direct cost to the Company or • an employee, contractor or subcontractor recordable injury; or • a fire or explosion resulting in greater than or equal to $2,500 of direct cost to the Company • A PRD discharge that both exceeds theThreshold Quantity (Tier 1 or 2) rate* and has one or more of the following four consequences: • Liquid carryover • Discharge to a potentially unsafe location • On-site shelter-in-place • Public protective measures (e.g. road closure) * The Threshold Quantity rate is calculated at the PRD. Tier 1 Tier 2
PSE Tiering for Releases from Pressure Relief Devices (PRDs) When one of these releases, and causes one of these: - an employee, contractor or subcontractor “days away from work” injury and/or fatality; or - a hospital admission and/or fatality of a third-party; or - an officially declared community evacuation or community shelter-in-place; or - a fire or explosion resulting in greater than or equal to $25,000 of direct cost to the Company it is a Tier 1 PSE. But if it causes one of these: - an employee, contractor or subcontractor recordable injury; or - a fire or explosion resulting in greater than or equal to $2,500 of direct cost to the Company it is at least a Tier 2 PSE, but it might still be a Tier 1 PSE if....
to here, and causes When one of these releases, here, or, discharge to a potentially hazardous location, or, an onsite shelter-in-place or here, or a road closure then you must estimate the quantity released through the Pressure Relief Device to determine the PSE Tier.
If the quantity released from this is greater than this, the event is a Tier 1 PSE.
If the quantity released from this is greater than this, the event is a Tier 2 PSE.
When one these releases, and none of the consequences on the previous slides occurs, record the event as a Tier 3 PSE regardless of the quantity released.
Data Inconsistencies – Contractor Hours • Contractor hours include: • Embedded contractors • Specialty contractors • Project hours (if not major construction) • Contractor hours do not include: • Delivery drivers • Large-scale projects that are typically fenced-off and not connected to the existing process (i.e. major construction)
Data Inconsistencies - Consequences • List all consequences for the Tier. • e.g. list both Threshold Release Quantities and Number of Days Away from Work or Fatalities • Exception: If the event is a fire or explosion, the chemical-released quantity is not required to report. • Basis: Chemical released is consumed by the fire/explosion. However, if the fire/explosion results in secondary release points the site shall report threshold quantities of other chemicals released. • Do not list Tier 2 consequences in Tier 1 except for those related to human impact (i.e. employee, contractor, or sub-contractor recordable injuries ).
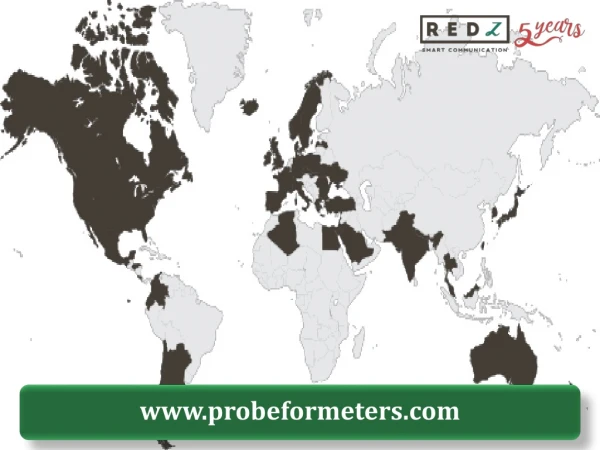
International Adoption • API and NPRA are reaching out to international organizations to encourage data collection alignment. • However, each organization will have its own report out. • Examples: ACC, CEFIC, CONCAWE, UKPIA
RP 754 - Broad Access [Nationwide] Public Reporting • API & NPRA Public Reporting Plan – Tier 1 and 2 • Annually, each Company publicly reports: • 2010 data – Implementation • 2011 data – Data validation • 2012 data – Industry aggregated result (public) • 2013 data – Industry and Company blinded results (public) • 2014 data – Industry and Company transparent results (public) • NOTE - Tier 2 reporting may lag Tier 1 by one year
2011 Data Collection • Improvements have been made to the data collection spreadsheet • Still one spreadsheet used by both API and NPRA • Spreadsheet will be distributed by 4th quarter 2011 for sites to begin collecting 2011 data
Conclusions • It will take a few years to ensure data consistency and validity - as was expected. • Don’t over-focus on the 2010 PSE rate but instead build confidence in your data through consistent reporting. • Trends over time are more valid than specific rates. • The true value comes from determining PSE causal factors, implementing corrective actions, and sharing lessons learned to prevent future events.
API website • API RP 754 Fact Sheet • Series of four webinars presented in fall 2010 (available for viewing) • Listing of FAQ’s that help you properly classify a PSE • API Guide to collecting PSE data • Read-only access to API RP 754 • http://www.api.org/ehs/health/measuring/index.cfm