Download
1 / 18
180 likes | 302 Vues
BUDGET 2011 et Plan triennal d’immobilisations 2011-2013. Évaluation imposable. 2010 : 1 947 490 460 $ 2011 : 1 985 037 660 $ Croissance : + 1,9 %. Secteurs Ville St-Georges (90) Paroisse Est Aubert-Gallion St-Jean Tous les secteurs. % du rôle Augmentation 75,9 % 2,9 %

E N D
Évaluation imposable • 2010 : 1 947 490 460 $ • 2011 : 1 985 037 660 $ • Croissance : + 1,9 %
Secteurs Ville St-Georges (90) Paroisse Est Aubert-Gallion St-Jean Tous les secteurs % du rôleAugmentation 75,9 % 2,9 % 12,5 % 0,8 % 9,3 % 1,2 % 2,3 % 1,2 % 1,9 % Variation du rôle d’évaluation 2011
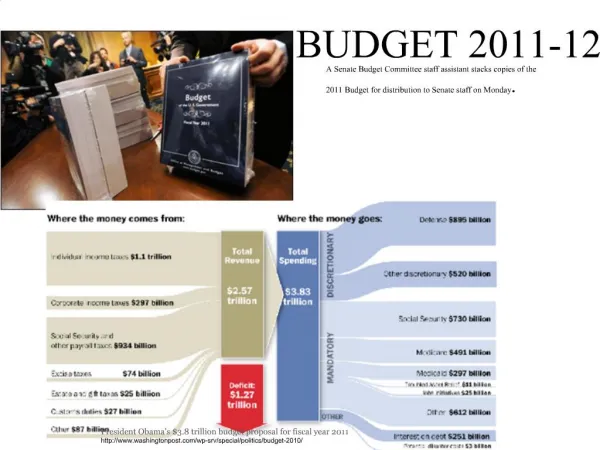
Répartition des revenus Les revenus de source locale représentent ±88 % des revenus de la Ville.
Plan final d’immobilisations 2011Mise à niveau des infrastructures
Plan final d’immobilisations 2011Qualité de vie et service aux citoyens
Plan final d’immobilisations 2011Qualité de vie et service aux citoyens
Sources de financement des immobilisations 2011 • Emprunts - Ville: 13 275 000 $ • Surplus acc. nouvelle ville : 1 405 000 $ • Promoteurs : 4 570 000 $ • Fonds d’administration : 1 355 000 $ • Fonds réservés : 4 985 000 $ • Subventions : 125 000 $ 25 715 000 $
Service de dette vs dépenses totales En incluant le paiement comptant de 873 000$ en 2011, le pourcentage est de 16.6%