Download
1 / 35
350 likes | 370 Vues
Review of Factorial ANOVA, correlations and reliability tests. COMM 420.8 Fall, 2007 Nan Yu.

E N D
Review of Factorial ANOVA, correlations and reliability tests COMM 420.8 Fall, 2007 Nan Yu
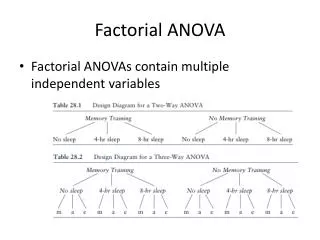
Factorial ANOVA(ANOVAdata.sav)More than one IV, both are nominal,DV is interval or ratio-levelBehavioral intention will vary as a function of the type of ads that are featured on the web site and the gender of the participants.IVs? DV?
Put the interval or ratio-level variable here. (DV) Put the variables representing the groups here. (IVs) Then Click "Options"
Put the group variable in the right window. Then click "continue" and "Ok." Select Compare main effects, Descriptive Statistics, Estimates of effect size, Homogeneity tests.
Main Effects Interaction P-values Test statistics Degrees of freedom Effect size Significant main effect for Gender, F (1, 72) = 31.55, < . 001, partial η2 = .31 No significant Main Effect for Condition, F (3, 72) = .74, p =.53, partial η2 = .03 No significant Gender X Condition interaction, F (3, 72) = 1.19, p =.32, partial η2 = .05
Creating Graphs Highlight these two numbers with mouse, right click Create Graph Bar
Significant main effect for Gender, F (1, 72) = 31.55, < . 001, partial η2 = .31
No significant main effect for Condition, F (3, 72) = .74, p =.53, partial η2 = .03
How to Create Line Graphs for Interaction Effects? Double click this table, then right click Select Pivoting Trays
Move the small square from bottom to the left Then, the means table will look at this.
Create Graph Line Highlight these numbers with mouse, then right click
Graphs for the Interaction Effects No significant Gender X Condition interaction, F (3, 72) = 1.19, p =.32, partial η2 = .05 These lines are not parallel, we can suspect that there might be interaction effects. But they are not statistically significant.
Correlations Correlations indicate the strength and direction of the relationship between variables.
Correlation Coefficients Dichotomous (dummy coded) Male=0 Female=1 Low=0 High=1
Hypothesis for correlations People’s liking toward sad movies will be positively related to the liking toward horror movies. Two variables, both interval.
SPSS and correlations Go to Analyze Correlate Bivariate
SPSS and correlations Put the two variables in this box, click OK
r=.28, p<.01 Consistent with the Hypothesis, respondents’ rating of their liking of sad files was significantly positively associated with their ratings of horror movies, r=.28, p<.01.
Reliability Test • If multiple interval of ratio measures were used to measure one construct, we need to know whether these measures are “hanging together” or not. Measurement of Fear: Scared 1 2 3 4 5 Frightened 1 2 3 4 5 Nervous 1 2 3 4 5
SPSS and Correlation Please open Correlationdata.sav Three items were used to measure “happiness” happy 1 2 3 4 5 6 7 content 1 2 3 4 5 6 7 joyful 1 2 3 4 5 6 7
SPSS and Reliability Test Go to Analyze Scale Reliability Analysis
Cronbach’s Alpha: If this number is greater than .70, meaning that three items hang together well Here you can see the changes of the reliability if one item is deleted,
Decision Tree for Data Analysis 1. Are both variables nominal? No (continue) 2. Are both variables interval or ratio? Chi-Square Test No (skip to 3) 2a. Are you examining associations between variables? Correlation 2b. Are you comparing means of two variables? Paired T-Test 3. Assuming that some variables are nominal and some are interval / ratio... Independent sample T-test 3a. Are you comparing means between 2 groups? (IV is nominal with 2 levels, DV is interval or ratio) 3b. Are you comparing means between more than 2 groups? (IV is nominal with more than 2 levels, DV is interval or ratio) ANOVA Factorial ANOVA 3c. Are you comparing means as a function of more than 2 IV s (a factorial analysis)?
In-Class Practice • Use the dataset of correlationdata.sav to Test the following hypothesis: Liking toward TV sports is positively related to total TV viewing per day. (tsports, totaltv) Can we reject the null? (Report the correlations and significance levels).
Answers to In-Class Practice Yes, we can reject the null. r=.19, p<.05 Consistent with the hypothesis, liking toward TV sports is positively related to total TV viewing per day, r=.19, p<.05