Download
1 / 72
720 likes | 895 Vues
Public Health Implications of Water Supply Improvements. Did Environmental Engineers save the world?. AguaClara needs a few bright (i.e. Cornell) students. To create improved and more detailed design algorithms to facilitate the global spread of the AguaClara technologies

E N D
Public Health Implications of Water Supply Improvements Did Environmental Engineers save the world?
AguaClara needs a few bright (i.e. Cornell) students • To create improved and more detailed design algorithms to facilitate the global spread of the AguaClara technologies • To identify and trap for design tool failures • To craft clear customized-automated documentation of the designs in both English and Spanish • To research methods to improve performance and reduce costs • To tell the AguaClara story and raise financial support
Review: Public Health Implications of Water Supply Improvements • The life expectancy transition • The role of water supply, sanitation, and hygiene • In the Global North a century ago • In the Global South • The U5MR connection • Exposure Routes: breaking the cycle • Pathogens in the loop • Implications for successful interventions
Life Expectancy Transition(Global North) Only intended to indicate trends! Modern Cities The transition Early Cities Pre-agrarian Poor-agrarian Who gets the credit?
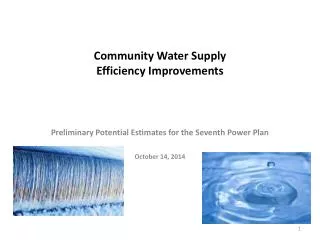
Life expectancy in England 90 males females 80 70 60 50 Life expectancy 40 30 20 From family reconstitution (mostly rural) From vital registration 10 0 1600 1650 1700 1750 1800 1850 1900 1950 2000 Year
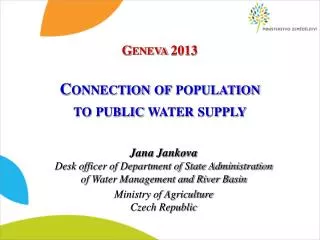
Life Expectancy in Sweden 90 80 70 60 50 life expectancy at birth 40 30 20 10 0 1750 1800 1850 1900 1950 2000 males females
Life Expectancy Transition(Global South) • Based on no data! (just my overly generalized thoughts…) • Increase in life expectancy is occurring later than in the North • Cities are generally benefiting sooner • Huge variation between and within countries Wealthy Poor Pre-agrarian Poor-agrarian
Distribution of deaths by age at death with mean = 75 years 30000 Disease that takes a lifetime to kill (high blood pressure, tobacco, cholesterol…) 25000 20000 Number of deaths / yr (for 100000 births/yr) 15000 10000 5000 0 0 3 8 13 18 23 28 33 38 43 48 53 58 63 68 73 78 82 91 Mean age at death in interval (nearest year)
Distribution of deaths by age at death with mean = 35 years 25000 Mean = life expectancy 20000 Why are these people dying young? 15000 (for 100000 births/yr) Number of deaths / yr 10000 5000 0 0 2 8 13 18 23 28 33 38 43 48 53 58 63 67 72 77 82 89 Mean age at death in interval (nearest year)
Mortality due to leading factors Inadequate food Water, Sanitation, Hygiene Air pollution
Burden of disease due to leading risk factors Disability-adjusted life year DALY:_______________________ Our focus in this course…
The role of Water Supply, Sanitation, and Hygiene • Contribute significantly to mortality and morbidity on the global level • Have an enormous influence on U5MR (under 5 mortality rate) • But why are these 3 items grouped together? • What is the effect of safe drinking water? • Let’s examine the role of safe drinking water in the life expectancy transition
Mills-Reincke Phenomenon ‘…. the purification of polluted public water-supplies reduces the general death-rate much more than it would be reduced by the saving of deaths from the commonly recognized water-borne disease, typhoid fever and Asiatic cholera alone.’ Sedgwick WT, MacNutt JS. On the Mills-Reincke phenomenon and Hazen's theorem concerning the decrease in mortality from diseases other than typhoid fever following the purification of public water-supplies. J.Infect.Dis. 1910; 7 : 489-564. This is the “Environmental Engineers Saved the World” Hypothesis.
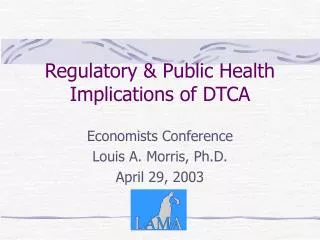
U.S. Typhoid Fever Mortality • Chlorination was begun in Jersey City, N.J., in 1908. Adoption by other cities and towns across the US soon followed and resulted in the virtual elimination of waterborne diseases such as cholera, typhoid, dysentery and hepatitis A 35 Chlorination begins in Jersey City 30 25 20 deaths per 100,000 15 10 5 0 1900 1910 1920 1930 1940 1950 year Chlorine saved the day
Chlorine Cause and Effect:What else would you like to know… • What was the mortality rate before the introduction of chlorine? • When did other cities adopt chlorination? • How did the mortality rate change for cities when they began chlorinating? • What other changes were occurring during the 1900s that may have influenced mortality?
Typhoid Fever Mortality Baden, Germany 1855 to 1881 Typhoid decreased here before water supply improvements!
Typhoid fever death rate per 100,000 inhabitants per year in Albany, NY Typhoid decrease coincided with water filtration!
Typhoid U.S. population supplied with filtered water Reduction in typhoid might be correlated with installation of filters
Correlation between Water Supply Improvements and Public Health? • A causal link? • Filtration • Chlorination • Delayed response? • No link? • US 1900 – 1940 interpretation?
Disease rates as measures of efficiency • “The final criterion of the efficiency of a purification plant is the absence or prevalence in the community of water-borne diseases. Typhoid fever being the most typical and widespread of such diseases, statistics of its prevalence are of much significance. Prior to the general introduction of purification works, the typhoid death rate was invariably high in many of our large cities drawing their supply from polluted rivers and lakes. Most of these cities are now supplied with satisfactory water, and many records could be given showing the marked effect of water treatment on the typhoid rate. The following data for the cities of New Orleans, Pittsburgh and Cincinnati will suffice.” Public Water-Supplies by Turneaure, Russell, Mead, Baker. John Wiley & Sons (1924) pages 430-431.
Evidence for a Causal Link:New Orleans, Pittsburgh, Cincinnati Pittsburgh, Cincinnati and New Orleans were used as evidence of the efficacy of filtration Public Water-Supplies by Turneaure, Russell, Mead, Baker. John Wiley & Sons (1924)
Let’s look at all the data using log scale (showing improvement ratio)
Trying to Understand the Data • “The steady reduction… is probably due in part to improved operation and in part to the gradual elimination of the disease from the community and so removing sources of contamination.” • What do you think? Public Water-Supplies by Turneaure, Russell, Mead, Baker. John Wiley & Sons (1924)
What else was happening?…education (one possibility) • ‘Infant care’ (US Children’s Bureau) • 12,000,000 copies • Baby care columns in leading newspapers • Carried by nearly all newspapers by 1912 (though not a few years earlier) • ‘Baby weeks’ • By 1919: 17,000 local committees • 11,000,000 directly involved
Causes of diarrhoea according to ‘Diseases of children’ 1889 1899 Sour milk Unripe fruit Inhalation of sewer gas Emanations from the soil ‘no doubt that the immediate cause is an infection of the alimentary canal, by …bacteria contained in milk or other forms of food’ Powerlessness! Empowerment
Changes recommended: public health campaign • Breast feed • Boil cow’s milk, sterilize bottles • Protect infants from persons known to be ill • Control flies • Wash hands You can improve your health!
Education of the Public ...the discovery of the possibilities of widespread social organization as a means of controlling disease was one which may almost be placed alongside the discovery of the germ theory of disease itself as a factor in the evolution of the modern public health campaign. -Winslow (1929)
Confounding Factors:Order of Interventions • If the drinking water was contaminated with typhoid and you mounted an education campaign to encourage hand washing… • You would conclude • If you installed a water treatment plant, but no one washed their hands… • You would conclude • These interventions are necessary, but not sufficient because there are ________ disease transmission routes No need to wash hands No need for clean water multiple
Reading the Typhoid Data • How long did it take for typhoid incidence to decrease? _____________ • If typhoid was waterborne how long should it have taken for filtration and chlorination to eliminate typhoid? _____________ • How does milk get typhoid? 30 to 40 years A few weeks Human excrement (milker’s hands?) or bovine excrement
My Typhoid Conclusions • The reduction was not due to a one time centralized change • Not due to filtration • Not due to chlorination • Was due to changes that occurred at different times throughout the population • Improved hygiene • Installation of toilets in bathrooms with sinks to wash hands • Education encouraging hand washing • Better food handling practices • Milk pasteurization • Refrigeration • Public Health Education
Maybe Env. Eng. saved the world from Cholera • Check for evidence that it was waterborne • Check for evidence of protection by filtration and/or chlorination
Sniffing out Cholera Courtesy of the National Library of Medicine
Cholera "Tramples the victors & the vanquished both." Seymour, Robert, 1798-1836. Artist.
John Snow: The great experiment • Snow's definitive work concerned the spread of cholera through water supplied by the Southwark Company and the Lambeth Company • Southwark obtained its water from the Thames at Batttersea, in the middle of London in an area almost certainly polluted with sewage • Lambeth Company obtained its water considerably upstream on the Thames, above the major sources of pollution • In an area containing about 300,000 residents the pipes of both companies were laid in the streets, and houses were connected to one or the other sources of supply.
Beautiful buildings, but the water… The view of three water companies by Hampton is southwest from the north side of the River Thames. The nearest building of the three companies is the Southwark and Vauxhall Water Company Source: Anonymous. Illustrated London News, 1855. Graciously provided by Bryce Caller, January 10, 2001.
Southwark and Vauxhall Water Company • In 1850, the microbiologist Arthur Hassall wrote of the River Thames water they were using,"...a portion of the inhabitants of the metropolis are made to consume, in some form or another, a portion of their own excrement, and moreover, to pay for the privilege." • Next Cartoon presents John Edwards, owner of the Southwark Water Company, posing as Neptune ("Sovereign of the Scented Streams"). He is seen crowned with a chamber-pot, seated on a stool on top of a cesspool which doubles as the water-intake for the Southwark Water Company customers in south London.
Southwark and Vauxhall Water Company Give us Clean water Devilish thick! Yea, have I slick! It makes me sick! Give us pure water We shall all have the Cholera Courtesy of the National Library of Medicine
The Grand Cholera Experiment • Those houses served by the Lambeth Company had a low incidence of cholera, lower than the average population of London as a whole • Those served by the Southwark Company had a very high incidence • The socioeconomic conditions, climate, soil, and all other factors were identical for the populations served by the two companies • Snow concluded that the water supply was transmitting the cholera agent • Snow's study is impressive since the germ theory of disease had not yet been established Proof that cholera was waterborne
Drinking Water Treatment and Germ Theory • 1829: First sand filter used to treat some of London's drinking water • 1850: John Snow established the link between drinking water (from a contaminated well) and Cholera • 1872: Poughkeepsie, NY installs first filter in US • 1885: Sand filters are shown to remove bacteria • 1892: Cholera outbreak in Hamburg, Germany
1892 Cholera outbreak in Hamburg Germany • Large outbreak of Cholera in Hamburg • 17,000 cases; 8,600 deaths • Very few cases in neighborhoods served by Altona's filtered water supply • Hamburg's sewers were upstream from Altona's intake! Hamburg Altona's water intake and filter beds Altona Hamburg's sewer outfalls Hamburg's water intake Elbe River
Altona vs. Hamburg: Cholera Cases Cholera cases Cases in Altona acquired in Hamburg Received water from Altona Altona Cholera was waterborne Hamburg Slow sand filtration may have protected Altona
Environmental Engineers are saving the world: Attempt #3 • Environmental engineers probably didn’t save us all from typhoid. • We have some evidence that filtration and water source affect public health from cholera • Could we make a case for our relevance by comparing current populations? • Compare modern countries with low and high U5MR and see what is correlated with infant mortality
U5MR by National Income in the Early 1990s Low performers (l to r): Congo, Gabon, Botswana, Turkey, Brazil High performers (l to r): Sri Lanka, China, Surinam, Jamaica, Costa Rica
Good and poor performers High: Sri Lanka, China, Surinam, Jamaica, Costa Rica Good Poor Low : Congo, Gabon, Botswana, Turkey, Brazil 26 the <5 mortality rate 104 3488 contrast GNP/person 4214 19 %underweight (<5yrs) nutrition 18 87 % with safe water public 65 85 health immunization % 76 3.6 spend on health* * as % of GNP 2.7 political 2440 pop'n per doctor 3638 support 8 soldiers per doctor 13
Good and poor performers High: Sri Lanka, China, Surinam, Jamaica, Costa Rica Good Poor Low : Congo, Gabon, Botswana, Turkey, Brazil 26 the <5 mortality rate 104 3488 contrast GNP/person 4214 2.7 total fertility rate 4.6 status of 5 yrs school f's >25** 2 women 116 maternal mortality 446 34 radios per 100 communications 18 6 newspapers per 100 3 Income disparity? ** mean yrs of schooling for women over 25
Conclusions: Good and Poor Performers • Safe water supply is correlated with decreasing U5MR • Lower fertility rate, higher female education, lower maternal mortality rate are all correlated with lower U5MR • Increased communication correlated with lower U5MR! Can’t prove cause and effect using this type of study
Hygiene Water treatment Sanitation Fecal-Oral Pathways Sanitation method Pathogen source Environment Transport washing Drinking water Human excreta Hands Dry sanitation involving reuse Surface water Water Waterborne sewage Oral Ground water Crops Non recycling latrines Food Animal excreta Land application Flies Soil
Read this as a critic. • What questions do you have? What would it take to reduce Diarrhea (and U5MR)? • 88% of diarrhoeal disease is attributed to unsafe water supply, inadequate sanitation and hygiene. • Improved water supply reduces diarrhea morbidity by 21%. • Improved sanitation reduces diarrhea morbidity by 37.5%. • The simple act of washing hands at critical times can reduce the number of diarrhoeal cases by up to 35%. • Additional improvement of drinking-water quality, such as point of use disinfection, would lead to a reduction of diarrhea episodes of 45%. 1.8 million people die every year from diarrhoeal diseases (including cholera); 90% are children under 5, mostly in developing countries. 1.6 9/11 attacks per day…
The case against looking for a Public Health Outcome • Epidemiological studies to measure a decrease in diarrhea in young children are • Expensive • Take a good deal of time • Are not guaranteed to produce any meaningful results even from the most successful program • Diarrhea is caused by many different pathogens through many different transmission routes • Confounding factors • Need to have an adequate control group • Results have little diagnostic power