Download
1 / 9
100 likes | 250 Vues
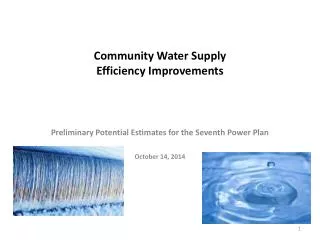
Community Water Supply Efficiency Improvements. Preliminary Potential Estimates for the Seventh Power Plan October 14, 2014. Water Supply Overview. Processes Collection Treatment Distribution Energy Consumption: Pumping 80% Treatment 20%

E N D
Community Water SupplyEfficiency Improvements Preliminary Potential Estimates for the Seventh Power Plan October 14, 2014
Water Supply Overview • Processes • Collection • Treatment • Distribution • Energy Consumption: • Pumping 80% • Treatment 20% • New regulations for treatment may change the mix slightly • Ozonation • Membrane Filtration • UV Disinfection • Source Type • Surface Water • More treatment energy • Less pumping energy • Ground Water • Less treatment energy • More pumping energy
Community Fresh Water in the PNW • USGS: 81% of PNW Population served by Community Water Systems • 52% is Surface Water* • 48% is Ground Water* • EPA: 4,570 community water systems in the 4 PNW states. • 240 plants serve 80% of population served by CWS’s * By volume
Energy Savings Measures • VFD’s and low head loss valves • Distribution system pressure optimization (strategic use of booster pumps) • Fix leaks in distribution system • Optimize filtration (pre-treat before filtering) • Pump efficiency optimization • Premium efficiency motors • Low pressure UV lamps versus med. pressure • High efficiency single stage blowers • Compressed air efficiency measures • Use of low friction linings or coatings in piping
Water Supply Achievements • Achievements in 2010 -2012 have averaged just over 1.0 aMW region wide.
Basic Formula (simplified) Flow - SW, GW (MGD) X Consumption Rate - SW, GW (kWh/MGD) = TOTAL CONSUMPTION (kWh) x Savings Rate (%) x Population Growth = Tech Potential in 2035 *SW=Surface Water, GW = Ground Water, MGD Million Gallons per Day Adjustments with new data
Plan Estimates • History • Sixth Plan Technical Potential: 16.2 aMW • Fifth Plan Technical Potential: 29 aMW • Seventh Plan Preliminary Potential • 10.7 aMW
Status • Will update if additional data received • AWWA Benchmarking report • Utility data