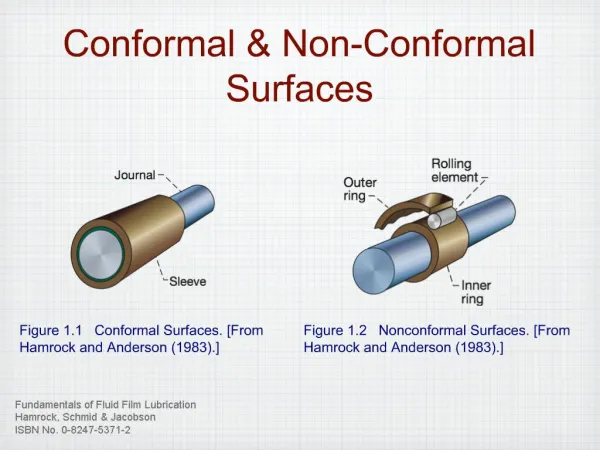
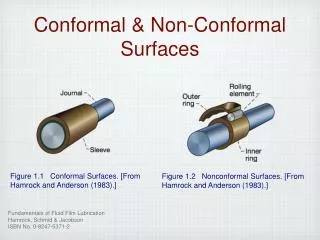
Conformal & Non-Conformal Surfaces
Conformal & Non-Conformal Surfaces. Figure 1.1 Conformal Surfaces. [From Hamrock and Anderson (1983).]. Figure 1.2 Nonconformal Surfaces. [From Hamrock and Anderson (1983).]. Hydrodynamic Lubrication. Minimum film thickness:. Figure 1.3 Characteristics of hydrodynamic lubrication.

Conformal & Non-Conformal Surfaces
E N D
Presentation Transcript
Conformal & Non-Conformal Surfaces Figure 1.1 Conformal Surfaces. [From Hamrock and Anderson (1983).] Figure 1.2 Nonconformal Surfaces. [From Hamrock and Anderson (1983).]
Hydrodynamic Lubrication Minimum film thickness: Figure 1.3 Characteristics of hydrodynamic lubrication.
Pressure Development Figure 1.4 Mechanisms of pressure development for hydrodynamic lubrication. (a) Slider bearing; (b) squeeze film bearing; (c) externally pressurized bearing.}
Elastohydrodynamic Lubrication Figure 1.5 Characteristics of hard elastohydrodynamic lubrication Figure 1.6 Characteristics of soft elastohydrodynamic lubrication
Regimes of Lubrication Figure 1.5 Film conditions of lubrication regimes. (a) Fluid film lubrication - surfaces separated by a bulk lubricant film; (b) partial lubrication - both bulk lubricant and boundary film play a role; (c) boundary lubrication - performance depends entirely on boundary film.
Friction for Various Lubrication Conditions Figure 1.8 Bar diagram showing friction coefficient for various lubrication conditions.
Wear Rates for Lubrication Regimes Figure 1.9 Wear rates for various lubrication regimes. [From Beerbower (1972)].
Boundary Lubricants Table 1.1 Fatty acids in oil as lubricants. [From Dorinson and Ludema (1985).] Figure 1.10 Effect of chain length on the effectiveness of a boundary lubricant. (a) Critical temperature as a function of chain length [From Bowden and Tabor (1950)]; (b) friction coefficient as a function of chain length. [From Zisman (1959).]}
Langmuir-Blodgett Films Figure 1.11 Effect of boundary lubricant thickness on friction for Langmuir-Blodgett films. [From Bowden and Tabor (1950).]
Boundary Lubricant Mechanisms Figure 1.12 Physisorption of of n-hexadecane molecules to a metal surface. [From Ku (1970).] Figure 1.12 Chemisorption of stearic acid to an iron-containing surface to form iron stearate. [From Ku (1970)]
Boundary Lubrication Mechanisms (cont.) Figure 1.14 Formation of sulfide layers on steel, an example of boundary lubrication through chemical reactions involving the substrate. Figure 1.15 Thermal activation of a boundary lubricant during the initial thermal cycle.
Bearing Classification Figure 2.1 Divisions of conformal fluid film bearings. Figure 2.2 Divisions of rolling-element bearings.
Guide to Journal Bearings Figure 1.5 General guide to journal bearing type. Except for rolling-element bearings, curves are drawn for bearings with width equal to diameter. A medium-viscosity mineral oil is assumed for hydrodynamic bearings. [From ESDU (1965).]
Guide to Thrust Bearings Figure 2.4 General guide to thrust bearing type. Except for rolling-element bearings, curves are drawn for typical ratios of inside diameter to outside diameter. A medium-viscosity mineral oil is assumed for hydrodynamic bearings. [From ESDU (1967).]
Surface Profiles Figure 3.1 Geometric characteristics of solid surfaces [From Halling (1976).] Figure 3.2 Difficulty in interpreting profilometer traces. (a) Surface profile; (b) surface asperity. Figure 3.3 Error due to stylus radius.
Compressed Surface Profile Figure 1.5 True (a) and compressed (b) profile. [From Thomas (1982).]
Atomic Force Microscope Figure 3.5 Schematic illustration of an atomic force microscope. (a) Principle of operation for an AFM. (b) Typical cantilevers for use in an atomic force microscope. [Source: Digital Instruments Corp.]
Devices for Surface Measurement Table 3.1 Summary of typical specifications of devices used for surface topography measurement. [From Sherrington and Smith (1988)].
Reference Lines • Mean or M System: Areas above and below the horizontal line are equal. • Ten-point average: Use five highest peaks and five lowest valleys • Least Squares: Similar to M System, but line can be inclined. Figure 3.6 Comparison of three types of reference line: (a) M system; (b) ten-point average; (c) least squares.
Roughness Issues Roughness measures: Figure 3.7 Geometric profiles having same values of arithmetic average. [From Halling (1976).]
Typical Roughness Table 3.2 Typical arithmetic averages for various processes and components.
Bearing Area Curve Figure 3.8 Surface profile showing bearing length. [From Persson (1992).] Figure 3.9 Abbot curves for two different profiles. [From Persson (1992).]
All-Ordinate Distribution Gaussian distribution: Roughness measures: Figure 3.10 Method of deriving all-ordinate distribution. [From Halling (1975).]
Skewness and Kurtosis Skewness: Kurtosis: Figure 3.11 Illustration of three different kurtosis values. [From Halling (1975).]
Autocorrelation Parameter Autocorrelation: Figure 3.12 Two different surfaces and resulting autocorrelation functions. (a) Periodicity profile; (b) decay profile. [From Halling (1975).]
Friction vs. Film Parameter Film parameter: Friction coefficients: Figure 3.13 Variation of friction coefficient with film parameter. [From Hamrock and Dowson (1981).]
Paraffins Table 4.1 Straight-chain paraffins [From Pugh (1970)]. Table 4.2 Homologous series of hydrocarbons. [From Hess (1981).]
Petroleum Products Table 4.3 Petroleum products with boiling point range and number of carbon atoms present.
Poly-Alpha-Olefin (PAO) Figure 1.5 Poly-alpha-olefin (PAO) structures. The “star” orientation displays superior lubrication properties. [From Kioupis and Maginn (1999).]
Greases Table 4.7 Typical characteristics of lubricating greases.
Fluid Viscosities Figure 4.2 Absolute viscosities of a number of fluids for a wide range of temperatures.
Viscosity of Gases Figure 4.3 Viscosity of common gases as a function of temperature. [From Cameron (1976).]
Viscosity of Gases Table 4.8 Viscosity of various gases at 14.7 psia. [From Svehla (1962).]
Properties of Liquids & Gases Table 4.9 Some properties of common liquids and gases at 68°F and 14.7 psia. [From Gross (1980).]
Emulsions • Typically 5% oil, 95% water. • Oil phase includes additives including emulsifier. • Emulsifier stabilizes emulsion and determines particle size. • Outstanding cooling properties and reasonable lubrication effectiveness. Figure 4.4 An oil-in-water emulsion stabilized by an emulsifier.
Newtonian Fluids Figure 4.5 Properties of a Newtonian fluid. (a) Effect of viscosity on shear strain rate; (b) effect of shear stress on shear strain rate. Figure 4.6 Physical illustration of Newton's postulate, where f = friction force, N; A = area, m2; u=velocity, m/s; h = film thickness, m.
Viscosity Conversion Factors Table 4.10 Viscosity conversion factors.
Kinematic Viscosity Kinematic viscosity: Table 4.10 Divergence between kinematic and absolute viscosity data with increasing temperature. [From Klaman (1984).]
Viscosity Grades Figure 1.5 Viscosity grade comparisons. [From Litt (1986).]
Viscosity-Pressure Effects Table 4.12 Absolute and kinematic viscosities of fluids at atmospheric pressure and three temperatures. [From Jones et al. (1975).]
Roelands & Barus Equations Barus Law: Roelands (isothermal): Figure 4.8 Comparison of absolute viscosity obtained from Barus' and Roelands' formulas for a wide range of pressure. Results are shown for three different lubricants at 38°C; oil 1 --- synthetic paraffinic oil (lot 3); oil 2 --- superrefined napthenic mineral oil; oil 3 --- synthetic hydrocarbon (traction fluid).