Download
1 / 38
380 likes | 517 Vues
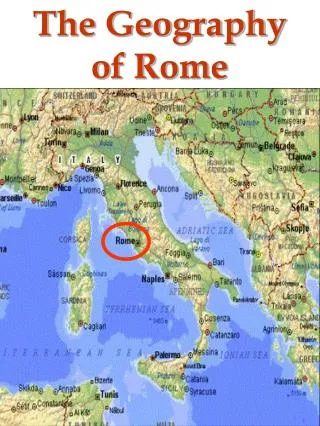
Results of the 2010 Reading of APHuman Geography. How is an exam develop? By Don Ziegler Old Dominion University Former Chair of Test Development Committee The Scoring and results of the 2010 exam By David A Lanegran Macalester College Chief Reader of AP Human Geography.

E N D
Results of the 2010 Reading of APHuman Geography • How is an exam develop? • By Don Ziegler Old Dominion University • Former Chair of Test Development Committee • The Scoring and results of the 2010 exam • By David A Lanegran Macalester College • Chief Reader of AP Human Geography
I. Questions on the AP Human Geography Exam • Multiple Choice Questions: 75 on each exam (60 min.) • Where questions originate • Development Committee members • Former Development Committee members • College instructors of Human/Cultural Geography • Characteristics • Linked to AP Human Geography Course Outline • Always 5 choices (A-E) • Graphic stimulus for some • Never “all” or “none” of the above • Never “cute-sy” or nonsense choices
I. Questions on the AP Human Geography Exam • Free Response Questions (FRQs): 3 on each exam (75 min.) • Where questions originate • Development Committee members • Former Development Committee members • Characteristics • Linked to AP Human Geography Course Outline • Require explanations, not thesis-based argumentation • Graphic stimulus for some • Often broken down into two or three parts
II. Vetting Process by AP Human Geography Development Committee • Multiple Choice Questions • Committee members read and answer each question • Committee discusses (face-to-face) all questions • Committee decides on the disposition of each question • Reject question • Accept question • Revise question • Question sent to ETS Fairness and Edit review • Question moves to pretest pool
II. Vetting Process by AP Human Geography Development Committee • Free Response Questions • Committee members read each question • All questions entered into pool
III. Field Testing Questions for the AP Human Geography Exam • Multiple Choice Questions • Tested in college classrooms • 60-question exams • End of human/cultural geography courses • Statistics generated from field testing • Difficulty • Discrimination • Questions that “test well” moved into operational pool • Questions with statistical problems sent back to committee • Committee decides on disposition of questions • Keep question in pool as is • Further revise question and send for “re-pretesting” • Eliminate question • Questions become active candidates for exam when they are field tested and accepted by the committee • Free Response Questions are not field tested.
IV. Compiling the AP Human Geography Operational Exam • Compilation begins 2-3 years before the year Exam is administered. • Multiple Choice Questions • ETS Assessment Specialist selects “equating set” from a previously administered test. • ETS stat analysis group approves equating set • ETS Assessment Specialist selects remaining multiple choice items (50) • From field-tested pool of questions • Proportional to major topics in AP Human Geography Course Outline • Statistically balanced (difficulty, discrimination)
IV. Compiling the AP Human Geography Operational Exam • Free Response Questions • Committee members select questions from FRQ Pool • Balance sought among the following: • Major parts of the AP Human Geography Course Outline • North American vs. International • Analysis vs. Synthesis • With Graphic Stimulus vs. Without Graphic Stimulus • Model-Based vs. Non-model Based • Revised by Committee Members with major input from Chief Reader • “Draft Rubrics” written by Committee members with major input from Chief Reader
IV. Compiling the AP Human Geography Operational Exam • Draft Exam reviewed by Development Committee • Multiple Choice section reviewed twice beginning two years before exam is given • Free Response section reviewed four to five times beginning three years before exam is given
V. Finalizing the AP Human Geography Operational Exam • Finalized in the spring before the year Exam is administered (e.g., 2010 exam approved in spring 2009) • Sent to printer
V. Scoring the Exam • Final rubric developed by Chief Reader, ETS Test Developer for APHG, Question Leaders and Lead Table Leaders. • Draft rubric is “ tested” against a large sample of exams. • Look for correct answers or interpretations not on draft rubric
The 2010 Free Responses • Question one • According to Alfred Weber’s theory of industrial location, three factors determine the location of a manufacturing plant: the location of raw materials, the location of the market and transportation costs
Question part A, B & C • Using an example of a specific industry, other than the one portrayed on the map, explain under what conditions an industry would locate near the market. • Using an example of a specific industry, other than the one portrayed on the map, explain under what conditions an industry would locate near raw materials. • Using the map above and Weberian theory explain the geography of ethanol plants in the United states
Question one • Two points for each part: one for industry and one for explanation • Part C required students to tell why and their reasons must be linked to Weber’s theory and discuss the weight loss situation
What was the intent of this question? • This question was designed to enable students to show the degree to which they understand and are able to apply Weber’s model of industrial localization. • The question prompted them with the name of the model’s creator so answers did not depend on the student remembering a specific individual’s name. • In addition to applying the model to industries they knew something about, they were asked to apply the model to the location of ethanol plans in the United States.
How well did students perform on this question? • The mean score was 1.89 out of a possible 6 points. • Approximately 50% of the test takers received no points for this question.
What were common student errors or omissions? • The most common error of those who attempted the question was confusing the Von Thunen model of agricultural land use around a city, with the Weber model of industrial localization. This confusion prevented them from developing a logical answer to the question. • A small number of students had no idea of what an ethanol plant is and could not answer the portion of the question that required using the map that showed the spatial relationship between corn production per acre and the location of ethanol plants.
What were common student errors or omissions? • Most students answered part one with soda bottling but did not say the water is the largest component and a ubiquitous resource so the smaller amounts of formula could be brought to the market. They were not penalized for this omission. • Even though the map was clearly labed i.e. corn production per acre and plant locations, some students did not understand the relationship between corn and ethanol plants
Teaching implications • The mean score on this question was a full point below the mean for question three which was also a 6 point question. • We thing this indicates • Teachers are not stressing the models as indicated in the course description • Teachers must help students understand that the models are to be appied
Question Two • Since 1950 many states have faced challenges in develop a strong national idenity.
Part A • Using contemporary examples explain how each of the following has contributed to the development of national identity and the strengthening of the State. • 1. Economic development. • 2. Relocation of a state’s capital.
Part B • Using contemporary examples explain how each of the following may detract from the development of national identity and the strengthening of the State. • 1. Ethnicity • 2. Transportation infrastructure
What was the intent of this question? • This question was designed to enable students to show how well they understand the implication of geopolitical state building strategies and the linkages between economic development and state building.
How well did students perform on this question? • The mean score was 2.66 out of a possible 8 points. Approximately 40% of the test takers received no points for this question.
What were common student errors or omissions? • There were two common errors. • One resulted from the students not carefully reading the question and therefore they confused the states of the United States with states at the national level. • The second general error was the lack of understanding of how the movement of a national capital would promote state development. • Some students showed an incomplete knowledge of centripetal and centrifugal forces on the development and stability of national states.
Teaching Implications • The instructors of AP courses must be sure to cover all sections of the course description and especially the political geography section. • Teachers must make sure their students understand basic terminology and can use it. • Teachers must demonstrate to students how to use fundamental concepts to answer questions that ask them to synthesize information. • Finally since the word state is used two ways in the United States, teachers must make sure their students are aware of the difference and are able place the word in context.
Question three • The population pyramids above represent two countries at different stages in the demographic transition and economic development.
Three parts each worth 2 points • A explain the demographic characteristics of each country with respect to the demographic transition model • Discuss one positive impact of each country’s population structure on its economic development • Discuss one positive impact of each country’s population structure on its economic development
What was the intent of this question? • The question was design to enable students to show how well they understand the demographic transition and the implication of a population’s demographic characteristics have on economic and social conditions and economic change
How well did students perform on this question? • The mean score was 2.45 out of a possible 6 points. Approximately 30% of the test takers received no points for this question.
What were common student errors or omissions? • Most students answered the first part of the question. • Many had trouble connecting the demographic characteristics of a country to its economy • The students seemed to have most difficulty understanding the positive impact of a stable or declining population.
Teaching implications • Teachers need to make every effort to help their students understand the connections among the sections of the APHG course of study. • The free response questions generally ask student to synthesize.
Teaching implications • While this group of students seemed to have a basic understanding of the demographic transition, they were not really able to draw conclusions from the model and the representations of demographic characteristics.
Mean SD total pts • Q1 1.89 1.96 6 • Q2 2.66 2.35 8 • Q3 2.45 1.68 6
Cut Scores • The cut scores were set slightly higher this year than last. • The students who took the test this year score lower on the equator multiple choice questions