Download

1 / 21
220 likes | 386 Vues
Manifestation of strong geomagnetic storms in the ionosphere above Europe. D. Buresova(1), J. Lastovicka (1), and G. D eFranceschi(2) (1) Institute of Atmospheric Physics, Prague, Czech Republic (2) Instituto Nazionale di Geofisica e Vulcanologia , Roma, Italy. Outlook.

E N D
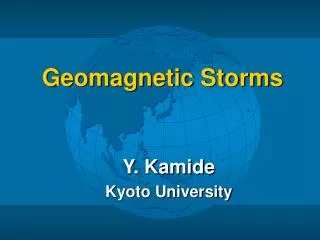
Manifestation of strong geomagnetic storms in the ionosphere above Europe D. Buresova(1), J. Lastovicka(1), and G. DeFranceschi(2) (1) Institute of Atmospheric Physics, Prague, Czech Republic (2)Instituto Nazionale di Geofisica e Vulcanologia, Roma, Italy
Outlook A pre-storm enhancement of foF2 Occurrence frequency of positive and negative phases of ionospheric storms TEC and scintillations at high latitudes Height profile of storm effect in the F region Storm effects in the F1 region
Data:Observed and IRI-2001-generated electron density N(h) profiles for 8 European stations for 65 strong (DsT<-100 nT)-to-great (DsT<-350 nT) geomagnetic storms from the period 1995 – 2005;geomagnetic activity indices for analyzed stormy periods. • Data sources: • COST296 Space Weather Database web side : • http://www.ukssdc.ac.uk/wdcc1//wdc_menu.html • Umass Lowell Center of Atmospheric Physics Digital Ionogram Database (DIDBase) • Data from selected European vertical incidence ionospheric stations • IRI web side: • http://modelweb.gsfc.nasa.gov/models/iri.html
List of contributing European vertical incidence ionospheric stations
The existence of magnetic storm and level of storm intensity was defined using Dst index in the following way: • Strong storm conditions where defined when Dst <-100 nT for at least 4 consecutive hours • Storms conditions prevail when Dst< -50 nT
The F region response to storm-induced disturbances is described in terms of deviations of NmF2 from the quiet time median values, i.e. δNmF2. Deviations less than 10% have not been taken into account. Different stations provide partly different pattern
65 storms – 15 with, 50 without a positive enhancement on the day before the storm
Observed (left panel) and IRI-2001generated (right panel) NmF2 over Europe, October 28, 2003 at 12:00UT – positive “quiet” disturbance before the storm– bad IRI-observation agreement
Observed (left panel) and IRI-2001generated (right panel) NmF2 over Europe, October 29, 2003 at 12:00UT – storm day – better observation-IRI agreement
Appearance of negative and positive phases of 65 ionospheric storms for three European stations
GISTM receiver at NY ALESUND, 78.9° N, 11.9° E The GISTM System consists of a high rate (50Hz) dual-frequency receiver with special firmware. It is specifically configured to measure and automatically record amplitude and phase of scintillations from the L1 GPS frequency and TEC from the L1 and L2 frequencies. 0ctober 30, 2003 event. Maps of TEC (corrected to vertical), S4 index, and phase scintillations between 21-22 UT from all satellites in view. The receiver location is shown with a red cross.
November 20 2003 event between 20-21UT Scintillations and TEC as signatures of the high latitude ionospheric response to geomagnetic storms
May 15 2005 event between 11-12 UT Some details at poster by Aquino et al. on scintillation monitoring (Wednesday)
20-11-2003, 20-21 UT 30-10-2003, 21-22 UT 15-05-2005, 11-12 UT From Mitchell at al., GRL, 2005 TEC, Phase and Amplitudescintillations at NyAlesund for three strong events as a function of latitude of the subionospheric point calculated for the assumed ionospheric altitude 350 km. Amplitude and phase scintillations seem to be associated with the increase in TEC, a characteristics of the edge of a polar-cap patch.
November 1998 geomagnetic stormChanges in midday electron density at different F region heights (the difference between mean Ne of the pre-storm quiet days and mean Ne during the geomagnetic storm main phase)
Comparison of changes in the midday electron density at different ionospheric altitudes during main phases of August 2000 and November 1998 geomagnetic storms
Geomagnetic storms effect penetration into F1 regionData for 36 strong geomagnetic storms (Dst <-100 nT) and super storms (Dst <-300 nT) from 1995 to 2002. • The main physical mechanism controlling the F1 region response to geomagnetic storm is change in ion composition, which is related to the neutral composition (O, O2, N2) seasonal and storm time variation. • Chilton (190 km) – light blue – much stronger storm effects in winter and autumn (winter half of the year)
Geomagnetic storms effect penetration into F1 regionDifferences between the midday mean Ne of the pre-storm quiet days Ne of the storm main phase and. The effects of superstorms (full columns) are larger and penetrate deeper than the effects of strong storms
Conclusions In spite of many years of investigations of effects of geomagnetic storms on the F region ionosphere, there are still many open questions, like the pre-storm enhancements of foF2, storm effects on the bottomside F region (they are relatively well known and understood in the F2-region maximum), or model (IRI) reproducibility of the observed geomagnetic storm-related effects. We are able to predict appearance of ionospheric storms based on geomagnetic storm predictions, but we cannot predict reliably phase (positive or negative) of the storm.
Some references: Buresova, D.: Effects of geomagnetic storms on the bottomside ionospheric F region, Adv. Space Res., 35, 429-439, 2005. Buresova, D., Lj. R. Cander, A. Vernon, and B. Zolesi: Effectiveness of the IRI-2001-predicted N(h) profiles updating with real-time measurements under intense geomagnetic storm conditions over Europe, Adv. Space Res., 2005 (accepted). Buresova, D., Lastovicka, J., Altadill, D., and Miro, G.: Daytime electron density at the F1 region in Europe during geomagnetic storms, Ann. Geophysicae, 20, 1007-1021, 2002. Lastovicka, J.: Monitoring and forecasting of ionospheric space weather – effects of geomagnetic storms. J. Atmos. Solar-Terr. Phys., 63, 697-705, 2002. Mikhailov, A.V., Schlegel, K.: Geomagnetic storm effects at F1-layer heights from incoherent scatter observations, Ann.Geophysicae, 21, 583-596, 2003. Mitchell, C N, L Alfonsi, G De Franceschi, M Lester, V Romano and A W Wernik, GPS TEC and Scintillation Measurements from the Polar Ionosphere during the October 2003 Storm, Geophys. Res. Lett., 32, L12S03, doi: 10.1029/20