Download
1 / 19
190 likes | 322 Vues
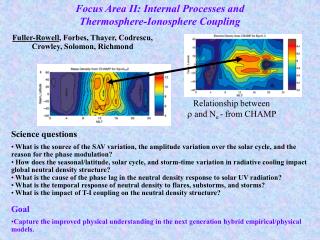
Variability in the thermosphere and ionosphere during small geomagnetic disturbances in April 2002. L. Goncharenko 1 , J. Salah 1 , A. Coster 1 , W. Rideout 1 , C. Huang 1 , S. Zhang 1 , L. Paxton 2 , Y. Zhang 2 , G. Crowley 3 , B. Reinisch 4 , V. Taran 5

E N D
Variability in the thermosphere and ionosphere during small geomagnetic disturbances in April 2002 L. Goncharenko1, J. Salah1, A. Coster1, W. Rideout1, C. Huang1, S. Zhang1, L. Paxton2, Y. Zhang2, G. Crowley3, B. Reinisch4, V. Taran5 1 Massachusetts Institute of Technology, Haystack Observatory, Westford, MA, USA 2 The John Hopkins University, APL., Laurel, MD, USA 3 Southwest Research Institute, San Antonio, TX, USA 4 University of Massachusetts Lowell, Lowell, MA, USA 5 Institute for Ionosphere, Kharkiv, Ukraine TIMED SWG
ISRs, Ne on April 15-16, 2002 Unusually low Ne on April 16, 2002 TIMED SWG
Millstone Hill digisonde, April 2002 Ionosondes: This is a global effect, observed from 40oE to 270oE at latitudes > 35-40oN April 16 TIMED SWG
ISRs, Ne on April 15-16, 2002 Millstone Hill, 43oN 289oE • Ne decrease on April 16 is comparable to the decrease during April 17 storm • Occurs throughout the whole day • Reduction in Ne at all altitudes • Accompanied by increase in Ti 7LT 7LT 10LT Kharkiv, 47oN, 50oE 13LT 17LT TIMED SWG
GPS TEC • Over 900 receivers • 3o x 3o lat/long bins • 20 min intervals • Error is 3-5 TEC units • No interpolation over areas without data TIMED SWG
GUVI O/N2 Global view of O/N2 column density Different UT time for different passes Crosses equator close to local noon TIMED SWG
April 16, 2002 April 15, 2002 GPS: Decrease in TEC GUVI: Decrease in O/N2 TIMED SWG
TEC and O/N2: longitude cuts • Reductions in both TEC and O/N2 by 30-50% in coincident regions • Decrease in TEC is caused by decrease in O/N2 • Reductions extend 150o in longitude from 60oE to 270oE • Reductions penetrate to 35-40oN • Reductions restricted to higher latitudes in Southern Hemisphere • Increase in O/N2 at some longitudes outside of this region GPS 60oE 300oE 240oE GUVI TIMED SWG
TIMEGCM/ASPEN model Model successfully predicts reductions in both TEC and O/N2, but in a smaller longitudinal area Depletions in TEC and O/N2 penetrate to middle latitudes The magnitude of simulated reductions is smaller compared to observations TEC 60oE 300oE 240oE O/N2 TIMED SWG
Features of the phenomena Long-lasting decrease in the daytime Ne caused by O/N2 reduction Observed globally Penetrates to middle latitudes Penetrates to lower latitude in summer hemisphere Successfully simulated by a model driven with realistic high-latitude energy input Typical signature of geomagnetic storm Variations in thermospheric and ionospheric parameters at midlatitudes depend on high-latitude energy input and effective transport of disturbances to lower latitudes TIMED SWG
Case 2: April 26-28, 2002 Large reduction in NmF2 at Millstone Hill Max Kp = 4+ Min SYM-H = -48 April28 TIMED SWG
April 26-28, 2002 Reduction in TEC and O/N2 in the same area Region with depletions extended from 330oE to 120oE Disturbances penetrate to 5-10oN at 300oE, to 45-55oN at other longitudes GPS 60oE 300oE 240oE GUVI TIMED SWG
Discussion • Players: • Total energy input (AE, HP) • Transport • Wind drivers: • Day-to-night circulation • Pressure gradients • Ion-neutral coupling • Primary mechanism (Burns et al., 1991) TIMED SWG
Discussion (cont.) • What affects winds through ion drag: • Solar activity • Killeen et al., 1995 – FPI data • Season • By component of IMF !!! • By > 0, Bz < 0 – larger dusk cell • By < 0, Bz < 0 – larger dawn cell • Killeen et al., 1995 – FPI data • Immel et al., 1997, Strickland et al., 2001 – DE-1 data TIMED SWG
IMF components April 14-16, 2002 April 26-28, 2002 By > 0 for many hours; By >= 5 nT TIMED SWG
HP By 90oE By < 0 0oE By > 0 TIMED SWG
HP By 90oE By < 0 315oE By > 0 TIMED SWG
Questions to ask • Other cases • By magnitude and sign • Positive effects (increase in O/N2,Ne) • Propagation in longitude and latitude • By negative – effects in the evening sector? • Effects in the Southern Hemisphere • More insights into origins of ionospheric variability TIMED SWG
Summary • Two case studies of small geomagnetic disturbances (Kp =3-, Kp=4+). • Decrease in O/N2 (GUVI) and Ne (ISRs, GPS, ionosondes) in the coincident area by 30-50%. • Reductions in O/N2 ratio and Ne penetrate to the latitude of 35-40oN for weaker disturbance (case 1), and to the latitude of ~5-10oN for stronger disturbance (case 2). • Similar variations are also predicted by the TIMEGCM/ASPEN model in both O/N2 ratio and Ne, though the magnitude of the variations in the model is smaller. • We suggest that strong and positive By component of IMF plays important role in delivering high-latitude thermospheric disturbances to lower latitudes close to local midnight. TIMED SWG