Download
1 / 13
150 likes | 380 Vues
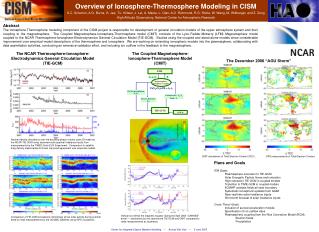
Ionosphere-Thermosphere Modeling. Tim Killeen, Stan Solomon, and the CISM Ionosphere-Thermosphere Team. Ionosphere-Thermosphere Overview. Perturbations in the Ionosphere-Thermosphere System. Positive & Negative ionospheric storm effects (TIE-GCM simulation, R. Roble, B. Foster).

E N D
Ionosphere-Thermosphere Modeling Tim Killeen, Stan Solomon, and the CISM Ionosphere-Thermosphere Team
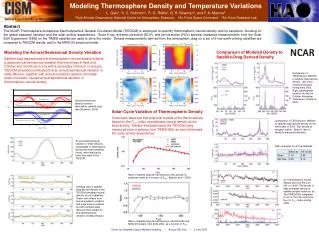
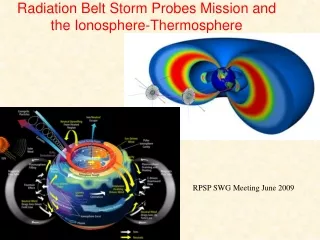
Perturbations in the Ionosphere-Thermosphere System Positive & Negative ionospheric storm effects (TIE-GCM simulation, R. Roble, B. Foster) Changes in neutral density following geomagnetic disturbances alters satellite orbits due to atmospheric drag, resulting in tracking anomalies
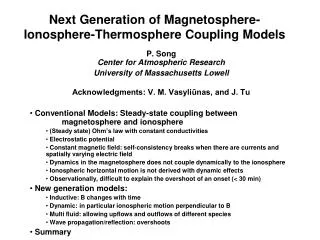
Magnetosphere - Ionosphere Coupling LFM Model Jll, np,Tp E Magnetosphere - Ionosphere Coupler Particle precipitation: Fe, E0 (SH+SP)=Jll Conductivities:Sp, Sh Electric potential: F TING Model One Way Coupling Two Way Coupling
Comparison of Coupled Models — Energy Flux & Ion Drift One Way Coupling Two Way Coupling
Comparison of Coupled Models — Conductivities One Way Coupling Two Way Coupling
Current Research: High-Resolution Polar Cap Modelwith Multiple Levels of Nested Grids Regular Grid (5°) Nested Grid (~1°) Electron Densities at F2 Peak (pressure level 2.0)
Ionosphere-Thermosphere Validation Matrix 1 Below ~130 km 2 O/N2 during the day, electron densities at night, also coupling parameters. Useful composition data could not be obtained from POLAR and IMAGE ‡ In situ or mainly in situ measurements, DE 2 and AE were multi-instrumented missions † Only some of these variables were available on any particular rocket flight. Generally sporadic. 3 Derived quantities with assumptions
M-I Coupling Validation Matrix 1 AMIE uses measurements of B by ground-based magnetometers and of E and B from DMSP and NOAA satellites. The resulting conductivities and potential pattern are reconciled, so the errors in potential are not large. However, the original estimates of conductivies come from ISR measurements that were developed using a Bates profile to describe the neutral atmosphere to derive the collision frequency. A Bates profile is not an accurate description of the thermosphere, especially in regions of auroral precipitation. Low latitude conductivities should not be used at all (see validation document). 2 See 1 for the difficulties with ISR conductivities. 3 Derived quantities with assumptions. * Archived DE 2, UARS data †Imagers provide measures of brightnesses in the UV. E0 and F can be derived from these brightnesses ‡In situ
Metrics • Rationale • • A robust set of metrics are needed that will be available for the foreseeable future. • • The data used for these metrics should not be subject to uncorrectable instrument drift and should be measured in the same way all the time. • • These metrics should reflect those developed by the Space Weather Programs metrics panel as closely as possible. • Plan • • Proposed metrics for the ionosphere: the maximum electron density at the F2 peak; the height of the F2 peak; and as a secondary product the maximum electron density at the E-region peak. • • Densities will come from ionosondes and height from incoherent scatter radars, although GPS measurements should also be considered when they become routine. • • Proposed metrics for the thermosphere: satellite drag and accelerometer densities; FPI red line temperatures; and O/N2 from satellite imaging when it becomes regularly available.
Research Plan Outline • Year 1 • Complete preliminary coupling of the TING model to the Dartmouth MHD model. (70%) • Test magnetosphere/ionosphere model with observations with and AMIE analysis. (10%) • Begin transition to nested-grid version of the TIE-GCM coupled with the MHD model. (50%) • Participate in development of model coupling framework design and specifications. (90%) • Year 2 • Couple MHD model and Rice convection model with the TIE-GCM. • Implement multi-processor version of coupled model, using coupling framework. • Initiate observational validation of magnetosphere/ionosphere coupled model. • Initiate development of graphical interfaces for output analysis. • Year 3 • Initiate development of algorithms to assimilate observational data into the TIE-GCM. • Continue observational validation of magnetosphere/ionosphere coupled model. • Continue development of graphical interfaces for output analysis. • Support coupling of solar wind model to magnetospheric model to create CISM model. • Year 4 • Extend TIE-GCM altitude range to include the plasmasphere. • Integrate new TIE-GCM with magnetosphere MHD model and Rice convection model. • Support validation of CISM model with observations. • Support installation of CISM model on NCAR computational facilities. • Year 5 • Transition to pre-operational model on special-purpose NCAR computational facility. • Implement data assimilation system with CISM model. • Conclude observational validation activities. • Conclude graphical interface development activities.
Meetings & Activities • Magnetosphere-Ionosphere coupling meeting Monthly, Access Grid • NCAR-wide general CISM meeting Monthly, HAO • Ionosphere-Thermosphere model development meeting Bi-Weekly, HAO • CISM executive committee Bi-Weekly, Telecon • CISM general meetings May kickoff, September retreat, March advisory council • Space Weather Summer School Lectures & Labs, BU
Issues and Challenges • Auroral energy flux and conductivity feedback (including solar ionization) — parameterization of auroral acceleration • Three-way coupling with the LFM and RCM — unified solution to potential fields? • Plasmasphere - ionosphere interactions — incorporation of plasmasphere model into TIE-GCM • Ion outflow • Sub-grid-scale phenomena and model resolution • Lower and middle atmosphere effects • Validation & metrics • Approach to data assimilation