Download
1 / 1
10 likes | 109 Vues
Utilizing the NCAR TIEGCM, this study examines global seasonal variations and solar activity influence on thermospheric neutral density. Satellite drag data and model simulations reveal insights into annual/semiannual density fluctuations.

E N D
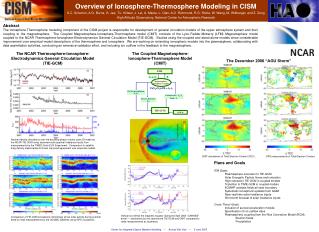
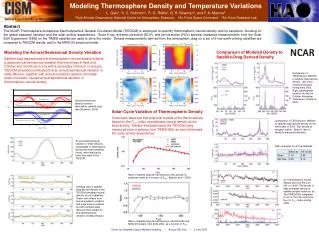
Modeling Thermosphere Density and Temperature Variations L. Qian1, S. C. Solomon1, R. G. Roble1, B. R. Bowman2, and F. A. Marcos3 1High Altitude Observatory, National Center for Atmospheric Research 2Air Force Space Command 3Air Force Research Lab Abstract The NCAR Thermosphere-Ionosphere-Electrodynamics General Circulation Model (TIEGCM) is employed to quantify thermospheric neutral density and its variations, focusing on the global seasonal variation and the solar activity dependence. Solar X-ray, extreme-ultraviolet (EUV), and far-ultraviolet (FUV) spectral irradiance measurements from the Solar EUV Experiment (SEE) on the TIMED satellite are used to drive the model. Density measurements derived from the atmospheric drag on a set of 5 low-earth orbiting satellites are compared to TIEGCM results, and to the MSIS-00 empirical model. Comparison of Modeled Density to Satellite-Drag Derived Density Modeling the Annual/Semiannual Density Variation Satellite drag data showed that thermospheric neutral density exhibits a global annual/semiannual variation that maximizes in April and October and minimizes in July with a secondary minimum in January. TIEGCM simulations indicated that an annual/semiannual variation in eddy diffusion, together with annual insolation variation and large-scale circulation, caused annual/semiannual variation in thermospheric neutral density. Comparison of TIEGCM and MSIS00 to satellite drag-derived density. Left: solar rotational variation during early 2003. Right: geomagnetic variation during the October-November “Halloween” storms of 2003. Annual/semiannual density variation detected by satellite drag data [Bowman, 2004] Solar-Cycle Variation of Thermospheric Density It has been observed that empirical models of the thermosphere based on the F10.7 index overestimate neutral density at low solar activity. Density simulated using the TIEGCM using measured solar irradiance from TIMED/SEE as input eliminated this solar-activity dependence. Comparison of TIEGCM and MSIS00 to satellite drag-derived density for the entire year of 2003. Top: density at perigee location. Bottom: ratio of model to measured densities. An annual/semiannual variation of eddy diffusion, comparable to observations and gravity-wave breaking theory, were imposed at lower boundary of the TIEGCM. Ratio averages for all five satellites: Ratio of satellite drag derived density to the Jacchia 70 empirical model as a function of F10.7, [Marcos et al., 2005]. (a) Thermospheric neutral density near 400 km from 2001 to 2006. The density is daily-averaged density at satellite perigee locations. (b) The TIMED/SEE integrated (5 nm to 105 nm) solar EUV flux. (c) F10.7 index and Ap index. Average ratio of satellite drag-derived density to the TIEGCM simulated neutral density, for all 5 satellites. Green: with effects from annual insolation variation and large-scale circulation, but with constant eddy diffusion; Red: added an annual/semiannual variation of eddy diffusion. Ratio of satellite drag derived density to the TIEGCM and MSIS-00 models, from 2002-2004, as a function of F10.7. Center for Integrated Space Weather Modeling • Annual Site Visit • 5 June 2007