Download
1 / 61
610 likes | 825 Vues
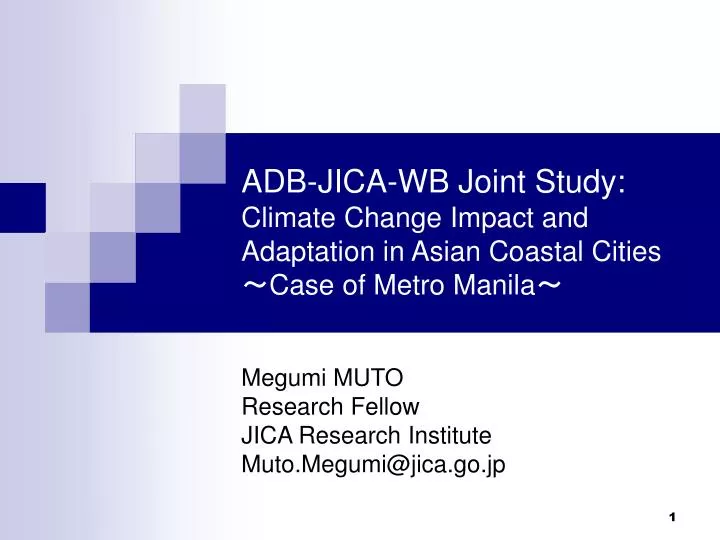
ADB-JICA-WB Joint Study: Climate Change Impact and Adaptation in Asian Coastal Cities ~ Case of Metro Manila ~. Megumi MUTO Research Fellow JICA Research Institute Muto.Megumi@jica.go.jp. 1. Downscale IPCC climate models for temperature increase @2050 for B1 and A1FI scenarios. 2.

E N D
ADB-JICA-WB Joint Study: Climate Change Impact and Adaptation in Asian Coastal Cities~Case of Metro Manila~ Megumi MUTO Research Fellow JICA Research Institute Muto.Megumi@jica.go.jp
1 Downscale IPCC climate models for temperature increase @2050 for B1 and A1FI scenarios 2 Assess local effects on precipitation and combine with sea level rise/ storm intensification Simulate different types of hydraulic effects: 1) through river systems, 2) through accumulation of water at lake, and 3) through sea level rise and storm surge at the coast (combination depends on city) 3 Based on the flood maps produced for 12 cases (3 climate scenarios x 2 infrastructure scenarios x 2 return periods), estimate socio-economic impact (both direct and indirect) with available data, thus deriving the benefit side of adaptation. 4 5 Consider investment mix and their costs necessary for adaptation (focusing on flood control infrastructure) 6 Conduct Net Present Value (economic, not financial) and EIRR calculations
Flood-prone areas in Manila In addition: ・Firm and urban poor household surveys to understand the details of vulnerabilities. ・Health impact analysis
Flood Prone Areas in Metro-Manila KAMANAVA Area Pasig-Marikina Basin West Mangahan Area
Downscale IPCC climate models for temperature increase @2050 for B1 and A1FI scenarios (University of Tokyo IR3S for all city case studies) 1
Assess local effects on precipitation and combine with sea level rise/ storm intensification 2
Simulation Cases (Case of Metro Manila) *Note: ground subsidence considered to arrive at local sea level rise
Simulate different types of hydraulic effects: 1) through river systems, 2) through accumulation of water at lake, and 3) through sea level rise and storm surge at the coast (combination depends on city) 3
Based on the flood maps produced for 12 cases (3 climate scenarios x 2 infrastructure scenarios x 2 return periods), estimate socio-economic impact (both direct and indirect) with available data, thus deriving the benefit side of adaptation. 4
Socio-economic assessment Source: Adapted with revisions from Southeastern Wisconsin Regional Planning Commission (1976) and Green et. al., (1983)
2020 Income Firms, residential Loss of Income Unit rate from Firm, household surveys Trips Generated/ Attracted (Public Mode) Time Value: Public Users “To work” & “Business” Trips Travel Time Delay Cost Traffic Zones Time Value: Private Users Trips Generated/ Attracted (Private Mode)
Added up benefits (savings) • Cost of buildings • Vehicle operation cost savings • Travel time savings through existing/future road investments • Avoided income loss (firms, formal/informal households) • Use future predicted values as much as possible. Use growth rate to arrive from these future values up to 2050. • Need more work on shadow prices, etc. • Should savings of power/rail operator be included?
DATA: Future Land Use of Metro Manila, 2020
DATA: Transport Infrastructure for Metro Manila, 2015
Trip data 2020 2003 2007 1999 Sources: JICA-MMUTIS and JICA-PPP/MUEN
Informal settlers data (present) 2020 2007 Sources: LGUs of MM and HLURB
Buildings’ Base Cost (present cost) Source: LGU Assessor’s Office
Building Damage Rates 2020 Flood Damage Rates by Building Use Source: Adapted from the Manual for Economic Study on Flood Control, May 2000, Ministry of Construction (presently the Ministry of Land, Infrastructure and Transport), Japan 1/ maximum rate given is for depth of 200-299 cm. The same rates are likewise applied to Institutional and Industrial.
Building Damage Costs (present cost) 2020 Cost of Damages to Buildings
Affected Vehicles 27 12 13 14 28 15 16 17 18 19 3 6 1 2 4 20 5 29 7 21 22 8 9 23 10 24 11 25 26 2020 Daily Traffic Volumes from Roadside Traffic Count Stations in Metro Manila
2020 Vehicle Operating Cost for Vehicles in MM Source: Department of Public Works and Highways, 2006 Price Levels Note: Computation for all flood scenarios.
Travel Time Value 2020
2020 Source: JICA-MMUTIS With a trip rate of 2.2, approximately 1.8 M students affected
Water facilities 2020 • No damage of flood assumed since: • Pipes are positively charged; • No record of flood–related • damage incidences; and • Facilities are above flood levels. Source: Maynilad Water Services and Manila Waters, Inc.
Power sector 2020 Flood-affected TRANSCO Substations in Metro Manila
2020 Affected Power Distribution Infrastructure
2020 Flood-affected RSS of Urban Rail Transport * Any impact on these substations would paralyze entire line. Source: Light Rail Transit Authority = income loss of P 4.7M per day for the line
Consider investment mix and their costs necessary for adaptation (focusing on flood control infrastructure) 5
Conduct Net Present Value (economic, not financial) and EIRR calculations 6
Framework for EIRR & NPV • Benefit side • Savings on Buildings • Savings on Travel Time • Avoid Loss of Income • VOC savings, etc. • Assumptions • Project Life of 50 years • 3 – 5 years Construction • 2010 start construction • Flood probabilities of 1/100 and 1/30 Investment Options and Mixes for Climate Change Adaptation Projects EIRR & NPV P30 Benefits P100 Benefits
In addition • Firm and urban poor household surveys to understand the details of vulnerabilities. • Health impact analysis. - both using present data
Household Level Geographic distribution of households
9 (3%) 35 (11.67%) 1 (0.33%) 118 (39.33%) 6 (2%) 53 (17.67%) 20 (6.67%) Not affected 58 (19.33%) Tidal surge Typhoon Flood Urban poor households affected by multiple-forms of disasters