Enhancing Precipitation Estimates through Mean Field Bias Correction: An Assessment
160 likes | 281 Vues
This assessment evaluates the efficacy of the Mean Field Bias (MFB) correction in improving precipitation estimates using radar and gauge data. Conducted by NOAA, the study aims to refine forecasting accuracy, particularly during significant rainfall events. It outlines the methodology used for analysis, case studies demonstrating both challenges and advantages of MFB implementation, and highlights improvements in forecast reliability. The findings underscore the necessity of adaptive parameters and ongoing evaluation to enhance meteorological services and customer satisfaction.

Enhancing Precipitation Estimates through Mean Field Bias Correction: An Assessment
E N D
Presentation Transcript
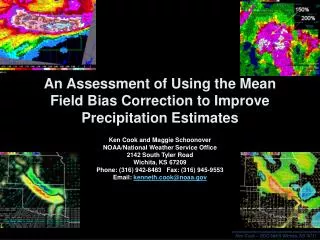
An Assessment of Using the Mean Field Bias Correction to Improve Precipitation Estimates Ken Cook and Maggie Schoonover NOAA/National Weather Service Office 2142 South Tyler Road Wichita, KS 67209 Phone: (316) 942-8483 Fax: (316) 945-9553 Email: kenneth.cook@noaa.gov
Outline • Introduction • Prompted Use • Methodology of Analysis • Assessment • Examination Results • Case Studies • Challenges • Advantages Ken Cook – SOO NWS Wichita, KS (ICT)
What is the Mean Field Bias? • A statistical analysis between the gauge observations and the radar bin that matches that gauge (NPair) • Performed hourly • Uses a minimum of 10 NPairs • If 10 cannot be ascertained during the current hour, then looks back in time until 10 is reached • User adaptable parameter • Applies this statistical analysis (one number) to the entire coverage area • Software part of Multi-sensor Precipitation Estimator (MPE)
Why Use It? • June 8th, 2005 case • 2-3X observed precipitation • Latest in a number of cases where precipitation estimates were less than desirable • Saw media partners using this bad data • Needed to improve forecasters confidence in radar estimated precipitation • Improve service/warning meteorology
Once Implemented • Results were instantly improved • Noticed some underestimation during various events • How much have we improved? • How can we make the system better? • Local training/learning • National science sharing/improve development
Methodology • Radar Data (ICT) • 12Z STP level III data from NCDC • Nexrad Exporter (create shapefiles) • ArcGIS 9, create rasters • Observation Data • Gathered 12Z Rain Gauge (Tipping Buckets/COOP) reports • Imported into Microsoft Access • Loaded then added XY Data in ArcGIS 9 • Compared Datasets for the period March through June 2006 • Resulted in ~ 400 G-R Observation Cases • Gauge data assigned a “bin” value • .45 gauge value assigned to the .3 to .6 radar “bin”
Results • Slight underestimation evident
Results • There seems to be a clear signal of slight underestimation • More noticeable as • Event grows in size • Amount of precipitation increases
Case Studies • 32 Gauge Observations • Light Rain Event • Average Gauge Observation .14 inches • Highest Gauge Observation .22 inches • Estimates were outstanding • Hourly MFB Calculations Very Consistent
Case Studies • 43 Gauge Observations • Moderate Rain Event • Average Gauge Observation 1.10 inches • Highest Gauge Observation 2.85 inches • Poorest estimation of the cases • Largest number of observations for one case (largest coverage) • Highest average precipitation • Hourly MFB Calculations somewhat less stable
Challenges - How to Improve the MFB • Use proper overlays in MPE to inspect suspect gauges • Inspect gauge table in MPE • Take out bad gauges from MPE ingest filter • Inspect MPE Local Bias for areas that may be over/underestimating as compared to Mean Field Bias
Advantages - Using the MFB • Better Precipitation Estimations • No change to Z/R relationship necessary • Updated hourly • Reacts to a warm rain process with no interaction • Improved credibility & customer service
Future • Continued assessment • Alter adaptable parameters? • Alter npairs? • Science sharing with developers other users • Incorporate differences from second/third runs of bias? • Assume 1:1 bias after no precipitation? • Goal: Improve performance • Thank you – Questions??
Resources • Cook, Kenneth (SOO – ICT), 2006: WFO Wichita Science and Training Intranet Page (http://204.194.227.45/soo/soopage.htm) • Training Materials Also Available • Hunter, S. M., 1996: WSR-88D rainfall estimation: Capabilities, limitations, and potential improvements. National Weather Digest 20 (4), 26-38 • WHFS Field Support Group Web Site (http://www.nws.noaa.gov/om/whfs)