Download
1 / 20
200 likes | 207 Vues
Adjustment to tropospheric warming over ocean and land surfaces. Adam Sobel, John Chiang, Deborah Herceg, Liqiang Sun, Michela Biasutti + many discussions with Isaac Held, Alessandra Giannini, Jian Lu, David Neelin…. Sahel Workshop, March 20, 2007.

E N D
Adjustment to tropospheric warming over ocean and land surfaces Adam Sobel, John Chiang, Deborah Herceg, Liqiang Sun, Michela Biasutti + many discussions with Isaac Held, Alessandra Giannini, Jian Lu, David Neelin… Sahel Workshop, March 20, 2007
Free tropospheric temperature is homogeneous, compared to SST and precipitation.
Single column model under the weak temperature gradient approximation (Sobel & Bretherton 2000, Zeng & Neelin 1999, Neelin & Held 1987…) Renno et al. (94) Emanuel (91) convection Chou et al. (91), Chou (92) radiation No clouds; crude PBL Surface winds fixed (above PBL) free troposphere T imposed PBL T calculated SST imposed
Precipitation in WTG simulations with Emanuel’s model. Dots are from observed January climatology of SST and Precip over oceans 20S-20N. Sobel and Bretherton 2000
Deep convection is controlled by stability of the sounding (e.g., Arakawa and Schubert 1974). The stability here is determined by the free tropospheric temperature and the SST. moist adiabat rising from sfc unstable, rain stable, no rain z CAPE>0 CAPE<0 free tropospheric T(z) same in both places low SST high SST
Typical El Nino precip anomalies are negative throughout the tropics, except the eastern/central Pacific. This suggests a global-scale explanation. Ropelewski and Halpert 1987
Interannual tropospheric temperature anomalies are very homogeneous within the tropics. Yulaeva and Wallace 1994
“remote tropics” (atmospheric column) This suggests a single-column modeling strategy to understand tropical ENSO teleconnections Free tropo PBL Central & E. Pacific west east This and several following slides adapted from John Chiang (work from Chiang & Sobel, 2002)
still fixed (though now time-dep) tropospheric temperature, but now over an interactive slab ocean mixed layer. (above PBL) free troposphere T imposed PBL T calculated slab ‘ocean’ SST calculated
Sea surface temperature precipitation OUTPUT In this case, we force the SCM with time-varying tropospheric temperature, representing that imposed on remote regions by SST in the Pacific. 79-99 observed tropical tropospheric temperature perturbation FORCING X
Convection Surface fluxes The ocean surface warming is impressed from above by the free troposphere, via the convective adjustment of the PBL to that, and then surface fluxes T’ Free troposphere the “upped ante” (Neelin et al. 2003) Planetary boundary (subcloud) layer e’ (equivalent potential temp) SST’ ocean
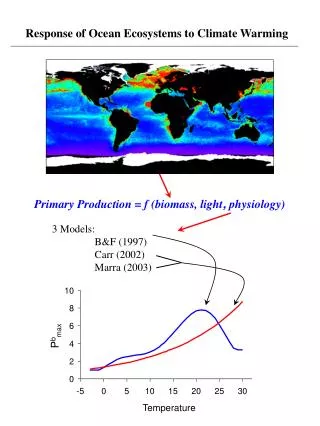
The precipitation response results from a disequilibrium: the upper ocean has not yet had a chance to adjust to the tropospheric warming. Adjustment is slower for a deeper mixed layer. Precip response requires ocean “memory” (unless TOA radiation changes). Forcing mld=1m Model precip mld=40m mld=160m
We view the tropospheric warming as being the ultimate driver of Tropical ENSO teleconnections, since the sign of precip anomalies is so spatially uniform. However, a range of processes, incl. 3D ones (advection) make things more complex than the single-column picture (many papers by Neelin and colleagues) How similar is global warming to ENSO? Not just temperature changes, but also radiation does, in a partly temperature-independent way In some models (GFDL) global warming looks somewhat ENSO like in the Sahel. Not in others (NCAR).
Regional modeling of Sahel Drought Sahel Herceg, Sobel, and Sun. Clim. Dyn., in press.
The Sahel drought of the late 20th century is well simulated by GCMs run in AMIP mode, which shows that it was a response to SST. Held et al. 2005
Some of the Sahel signal appears to be induced by sulfate aerosols, which induce a north-south SST gradient. Some may also be due to warming, a la ENSO.
We take a GCM (ECHAM) run in AMIP mode, which gets the drought, and use it to force a regional climate model (NCEP Regional Spectral Model). GCM RCM Obs 1950s JAS Precipitation 1980s difference
Then, we take the boundary conditions from a wet year, but raise the tropospheric temperature by a horizontally uniform vertical profile (with appropriate structure). This represents global warming, or ENSO. ECHAM 80s-50s T ECHAM 1950s + or Regional model NCEP/NCAR 80s-50s T
1980s minus 1950’s precip T from GCM T from NCEP reanalysis The Sahel dries in response to a uniform warming of the troposphere.
These results show that at least some of the Sahel drought (or its El Nino response) may be due to tropospheric stabilization by SST increases elsewhere, as in our ocean ENSO SCM simulations. However, we don’t understand the land-atmosphere interactions very well yet. The nature and duration of the surface “memory” (needed for precip response) is the first question.