Download
1 / 18
180 likes | 236 Vues
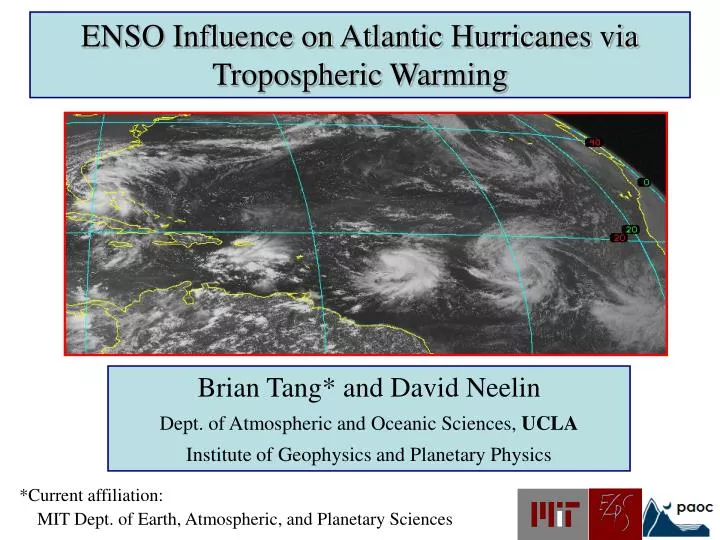
ENSO Influence on Atlantic Hurricanes via Tropospheric Warming. Brian Tang* and David Neelin Dept. of Atmospheric and Oceanic Sciences, UCLA Institute of Geophysics and Planetary Physics. *Current affiliation: MIT Dept. of Earth, Atmospheric, and Planetary Sciences.

E N D
ENSO Influence on Atlantic Hurricanes via Tropospheric Warming Brian Tang* and David Neelin Dept. of Atmospheric and Oceanic Sciences, UCLA Institute of Geophysics and Planetary Physics *Current affiliation: MIT Dept. of Earth, Atmospheric, and Planetary Sciences
ENSO N Atlantic teleconnection theory Tropical cyclogenesis and tropical cyclone intensity theory During an El Nino, wave dynamics spread anomalously warm tropospheric temperatures eastward over the tropical Atlantic. SST is brought into equilibrium with the troposphere after ~4-5 months. Warmer than normal tropospheric temperatures relative to SST increases the moist static stability of the atmosphere. Tropical cyclogenesis and intensification are hindered. If prolonged ENSO induced tropospheric temperature anomalies occur over the tropical N Atlantic without being compensated by SSTs, seasonal tropical cyclone frequency and intensity may be impacted.
Indices NAtlSST: Seasonal (Jun.-Nov.) box averaged SST anomalies NAtlTT: Seasonal box averaged tropospheric temperature anomalies ENSO: Seasonal Nino3.4 anomalies Frequency: Seasonal number of named N Atlantic tropical cyclones Intensity: Seasonal average maximum wind speed of all named N Atlantic tropical cyclones Boxed region used for area averaging. Contours are correlations between NAtlSST and seasonal tropospheric temperature at each grid point.
Simple Linear Regression: Frequency regressed on NAtlSST Variance explained (R²) = 31% Frequency regressed on NAtlTT Variance explained (R²) = 1% Multiple Linear Regression: Frequency regressed on NAtlSST & NAtlTT R² = 60% NAtlTT contains information independent of NAtlSST that is important to the physical pathways that influence TC frequency & intensity in the N Atl. Time series of NAtlTT and NAtlSST. Note the collinearity!
1st principal component – EQ PC 90% of the variance between NAtlTT and NAtlSST Measure of equilibrium between SST and tropospheric temperature 2nd principal component – DEQ PC 10% of the variance between NAtlTT and NAtlSST Measure of disequilibrium between SST and tropospheric temperature, i.e. an empirical measure of atmos. convective instability relative to SST Correlations of defined indices & principal components with N Atlantic TC frequency and intensity
DEQ PC tied to onsetting El Nino/La Nina events Time series of DEQ PC and [Jun:Nov] Nino3.4 anomalies
Regression coef for DEQ PC[K/K], Frequency [#storms/K], Intensity [knots/K], & Aug-Oct Nino3.4 [K/K] regressed on a sliding 3 mon averaged Nino3.4 window. 0 lag corresponds to middle of the contemporaneous hurricane season. Frequency & Intensity show a similar pattern as DEQ PC except inverted. Supports a thermodynamic pathway between ENSO and TC activity over the N Atlantic.
Regression coef for EQ PC [K/K] and Nov.-Jan. Nino3.4 (8.5 month lead) [K/K] regressed on a sliding 3 mon averaged Nino3.4 window. EQ PC is strongly influenced by ENSO events from the preceding fall/winter. By the time hurricane season rolls around, equilibrium has been reestablished between the sea surface & troposphere.
Gridded seasonal (Jun.-Nov.) tropospheric temperature anomalies regressed on DEQ PC(top) and regressed on May-July Nino3.4 anomalies (2.5 month lead) (bottom). Regression coefficients contoured [K/K] and 90, 95, and 99% significance levels shaded.
Gridded seasonal (Jun.-Nov.) SST anomalies regressed on DEQ PC. Regression coef contoured [K/K] and 90, 95, and 99% significance levels shaded.
Summary DEQ PC is associated with departures from SST and tropospheric temperature varying in equilibrium & can also be interpreted as an empirical measure of convective instability relative to SST. DEQ PC has high correlations to N Atlantic TC Frequency and Intensity relative to both NAtlSST and NAtlTT. DEQ PC is strongly correlated to ENSO through the hurricane season and into the following winter. Onsetting El Nino events create a disequilibrium state in which NAtlTT is warmer relative to its normal relationship to NAtlSST creating a large scale environment which is less conducive to TC intensification and tropical cyclogenesis. EQ PC is related to the prior winter ENSO, consistent with equilibrium being reestablished after past ENSO forcing on a time scale of several months.
Tang, B. H., and J. D. Neelin (2004), ENSO Influence on Atlantic hurricanes via tropospheric warming, Geophys. Res. Lett., 31, L24204, doi:10.1029/2004GL021072. Link:http://www.agu.org/journals/gl/gl0424/2004GL021072/
Data Time Period:1979 – 2003 SST:HADISST (1979-1981) and OISSTv2 (1982-2003) Tropospheric Temp:NCEP/NCAR Reanalysis (1979-2003) ENSO:Nino3.4 Index (5S-5N, 120W-70W) Hurricane Data:Best Track Reanalysis Data
DEQ PC can be regarded as an empirical measure of atmospheric convective instability relative to SST -DEQ PC = a*NATLTT(pressure) + b (a) >95% significant Regression coefficients, a, of -(DEQ PC) regressed on layered NATLTT as a function of pressure levels
ENSO influences N Atlantic tropical cyclone frequency and intensity Scatter plots of Frequency index and Intensity index with ENSO index DEQ PC also influences N Atlantic tropical cyclone frequency and intensity Scatter plots of Frequency index and Intensity index with DEQ PC
R | freq winds nino34 natlsst natltt eqpc deqpc ------+-------------------------------------------------------------- PIpmin| -0.6776 -0.1408 0.2574 -0.8321-0.4192-0.6688 0.6480