Download

1 / 30
300 likes | 406 Vues
This research explores the impact of warming on thermokarst features within the continuous permafrost zone of Western Siberia. Utilizing remote sensing data from Landsat and other satellite images spanning 1973 to 2006, this study analyzes climatic parameters, such as air temperature and precipitation, from 156 meteorological stations. The results highlight significant changes in thermokarst lakes, illustrating their expansion over time and correlating these changes to climatic variations. The findings provide insights into cryogenic transformations and their implications for the environment.

E N D
Институт химии нефти СО РАН Югорский НИИ Информационных технологий Institute of Petroleum Chemistry SB RASUgra research institute of informationtechnologies STUDY OF WARMING INFLUENCE ON THERMOKARST STATE IN CONTINUOUS PERMAFROST ZONE OF WESTERN SIBERIA ON BASE OF REMOTE SENSING DATA Yu.M. Polishchuk1,2, V.P. Dneprovskaya1, N.A.Bryksina2, 31Institute of Petroleum Chemistry, SB RAS,3, Akademichesky Ave., Tomsk, 634021, Russia2Ugra State University16, Chekhova street, Khanty-Mansiysk, 628012, Russia3Ugra research institute of information technologies151, Mira street, Khanty-Mansiysk, 628011, Russia
DATA and OBJECTS OF GEOCRYOLOGICAL STUDIES
Climatic data Long-term time numbers of mid-annual values of air temperature, quantity of atmospheric precipitation and other climatic parameters, received at 156 meteorological stations in West-Siberian territory for the period 1955 - 2006 years have been analyzed. Remote sensing dataCollections of space images of 1973-2006 years Landsat - 1 (scаnnеr MSS), 10.08.1973 Landsat - 5 (scаnnеrMSS), 27.07.1984 Landsat - 5 (scаnnеr MSS), 26.06.1988 Landsat - 4 (scаnnеrТM), 01.08.1988 Landsat - 5 (scаnnеrТM), 20.09.1989 Resurs - F2 (scanner МК 4), 14.06.1993 Landsat - 7 (scаnnеrETM), 07.08.1999 Landsat - 7 (scаnnеrETM), 03.08.2001 Landsat - 7 (scаnnеr ETM), 03.07.2002 Spot - 5 (scаnnеr HRV), 20.07.2005 ERS-2 – 2005, June – 2006, September ENVISAT – 2004, May - September
1 2 Objects of geocryological studies The most effective geoindicators of cryogenic changes of permafrost territories under global warming using remote sensing are thermokarst lakes. Below is a fragment of space image Landsat-7 (07.08.1999г.)with indicated objects of geocryological studies: thermokarst lakes - 1; dried lakes (khasyreys) – 2.
CHARACTERISTICS of PILOT TERRITORIES and OBJECTS OF GEOCRYOLOGICAL STUDIES
Some results of climatic changes analysis
Climatic changes in southern part of Western Siberia (territory of Outside the permafrost) Mid-annual values of air temperature Mid-annual air temperature in the second period (1980-1992 years) in comparison with the period of 1955-1970 years has increased approximately 1,0 0С Quantity of atmospheric precipitation has increased approximately 0.2 mm Quantity of atmospheric precipitation - Mean value - confidence limit for 90 % confidence probability
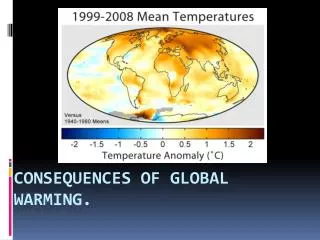
- Mean value - confidence limit for 90 % confidence probability Temperature changein territory of Continuous and Discontinuous permafrost section (Yamal-Nenets region) Mid-annual air temperature in the second period (1980-2006 years) in comparison with the period of 1973-1979 years has increased 0,96 0С
Methodical questions of analysis of geocryologic changes
Space image Landsat-1 (10.08.1973) with indicated thermokarst lakes
Comparison of space images Landsat-1 (10.08.1973) and Spot-5 ( 20.07.2005)
а b c d Consequent stages of decrease of lake 7 area Thermokarst lake 7 areas (red) changes
c а b d Consequent stages of decrease of lake 9 area Changes of area of thermokarst lake 9 (red)
Consequent stages of changesof lake 52 area in PT-5 b a e c d Decrease of area (red) of thermokarst lake 52 in time Decrease of area (red) of thermokarst lake 52 in time
Intraseasonalchanges of thermokarst lakes areas using radar images ERS-2 and ENVISAT PT-1 2004 -2005 г. Date Date Date
Intraseasonalchanges of thermokarst lakes areas using radar images ERS-2 PT-5 2005 -2006 г. Date Date
Analysis of lakes area changes in PT-1 Total area of lakes : 1973 - 2155,1 ha, 2005 - 1902,2 ha. Decrease of lake area Increase of lake area No changes
Total analysis of changes of lake’s areas in PT-5 Total area of lakes : 1984 - 3165.7ha, 2001 - 2892.4ha. Decrease of lake area Increase of lake area No changes
Results of analysis of geocryologic changes
Samples of lakes areas changes in continuous permafrost zone Arctic tundra, PT-10, PT-11 PT-11 PT-10 Total area of lakes : 1984 – 3463,5ha, 2006 – 3761,0ha. Total area of lakes : 1984 – 3421,2 ha, 2006 – 3765,3 ha.
Changes of summarized area of thermokarst lakes in continuous permafrost zone k- Normalized total area of lakes increase
Change of summarized area of thermokarst lakes in discontinuous permafrost zone k- Normalized total area of lakes decrease
Normalized value of thermokarst lakes areas depending on degree of latitude Degree of latitude k