Download
1 / 28
280 likes | 459 Vues
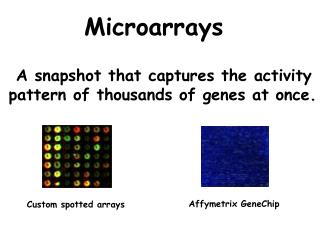
Microarrays Lecture Slides Courtesy of Dr. Tim Hughes t.hughes@utoronto.ca Outline: Microarray experiments Different types of microarrays Clustering and interpretation. Nucleic Acid Hybridization. www.accessexcellence.org/AB/GG/nucleic.html. Typical use of cDNA microarrays:

E N D
Microarrays • Lecture Slides Courtesy of • Dr. Tim Hughes • t.hughes@utoronto.ca • Outline: • Microarray experiments • Different types of microarrays • Clustering and interpretation
Nucleic Acid Hybridization www.accessexcellence.org/AB/GG/nucleic.html
Typical use of cDNA microarrays: “Internal” normalization using two colors x x x y x x y y y z z z x y z treatment (drug, mutation) control cDNA pools up down unchanged not present
“cDNA microarrays” are essentially dot-blots on glass slides 0.45 mm • This slide was made with 16 pins • 4.5 mm pin spacing matches 384-well plates (16 x 24) • Done with robotics • Slides usually coated with poly-lysine • Spots are usually 100-150 microns • Spot spacing is usually 200-300 microns. • Slides are 25 x 75 mm • Easy to deposit 20K spots/slide http://arrayit.com/Products/Printing/Stealth/stealth.html
Microarray expression profiling by 2-color assay (“cDNA arrays”) Array: PCR products 6250 yeast ORFs hybridized cDNAs: green = control red = experiment *Schena et al., 1995
Image processing and normalization: what is microarray data? Microarray data is summary information from image files that come out of the scanner. Image processing: line up grids, flag bad spots, quantitate.
Looking at data from a single experiment 3-AT vs. No drug 2 1 0 -1 -2 log10(ratio) -2 -1 0 1 2 wild-type vs. wild-type 2 1 0 -1 -2 log10(ratio) -2 -1 0 1 2 log10(average intensity)
Photolithographic arrays (Affymetrix) Building up oligonucleotides on a surface: http://www.affymetrix.com/technology/manufacturing/index.affx
Photolithographic arrays (Affymetrix) Arrays are typically 25-mers, with “mismatch” control for specificity aka “GeneChip”
Photolithographic arrays (Affymetrix) Advantages: Density is limited essentially by the 5 micron resolution of scanners (solution: larger arrays). Well-developed protocols. “Industry standard” (largely self-driven). Disadvantages: Not all probes work well. Affymetrix has evolved a complicated system to compensate for this, but even “believers” use at least four probes per gene, and usually more. Single color. Sample preparation typically requires amplification. Single supplier; historically intellectual property issues. (i.e. comparisons)
Ink-jet arrays (Agilent) G A G T C A C G G G C T G A A • 25,000 oligos / 1 x 3 inches • Sequence completely flexible • 60-mers Hughes TR et al. Expression profiling using microarrays fabricated by an ink-jet oligonucleotide synthesizer. Nat Biotechnol. 2001 Apr;19(4):342-7.
Ink-jet arrays generally agree with spotted cDNA arrays r = 0.97 Yeast IJS array: ~8 oligos per gene Spo vs. SC r = 0.96 multiple oligos single oligo HXT4 HXT3 HXT1 cDNA array cDNA array
Ink-jet arrays (Agilent) Advantages: User-specified sequences; “no questions asked” Sensitivity and specificity are defined and exceed requirement for most expression profiling applications; no amplification required Virtually every 60-mer is functional Data correlates well with spotted cDNA arrays Disadvantages: Density currently limited to ~45,000 spots per array. Single supplier (although a protocol is in press for making your own synthesizer!)
-10 -5 -2 1 2 5 10 fold repression fold induction 2-D clustering Step 1: cut experiments and transcripts falling below P-value and ratio thresholds transcript response index 44 experiments x 407 genes experiment index
ste mutants RHO O/X PKC O/X treatment with alpha-factor Data from Roberts et al., Science (2000) -10 -5 -2 1 2 5 10 fold repression fold induction 2-D clustering Step 2: cluster experiments and transcripts transcript response index experiment index
There are many types of clustering. One example: K-means (must choose K) See: Sherlock G. Analysis of large-scale gene expression data. Curr Opin Immunol. 2000 Apr;12(2):201-5. K = 10 #1 #2 #3
Basics of clustering freeware: Eisen’s “Cluster” and “Treeview” Mike Eisen's web site: rana.lbl.gov/EisenSoftware.htm “Cluster” loads an Excel file (save as tab-delimited text) in the following format: Cluster Treeview (also: “TreeArrange” - http://monod.uwaterloo.ca/downloads/treearrange/) There are also many commercial programs available.
protein mRNA nucleus cell
cis, trans regulators Microarray expression data Co-regulated groups of genes Functional categories Predict functions of new genes
GO-Biological Process categories # annotated genes (mouse) metabolism 1548 Very Broad development 2341 vision 163 Broad CNS development 137 eye morphogenesis 21 ATP biosynthesis 36 Mid-level pigment metabolism 25 striated muscle contraction 33 eye pigment metabolism 3 Narrow 4 insulin secretion
GO-Biological Process hierarchy metabolism development CNS development pigment metabolism eye morphogenesis eye pigment metabolism
Other types of categorical annotations: KEGG, EC numbers (describe biochemical “pathways”) MIPS, YPD (yeast databases – older than GO) Results of individual studies (localization, 2-hybrid screens, protein complexes, etc. Sequence motifs, structural domains (pfam, SMART)
Non-overlapping yeast gene expression clusters Cluster label amino acid metabolism arginine biosynthesis arginine catabolism aromatic AA metabolism asparagine biosynthesis branched chain AA synth lysine biosynthesis methionine biosynthesis sulfur AA tnsprt, metab adenine biosynthesis aldehyde metabolism biotin biosynthesis citrate metabolism ergosterol biosynthesis fatty acid biosynthesis gluconeogenesis NAD biosynthesis one-carbon metabolism pyridoxine metabolism thiamin biosynthesis 1 thiamin biosynthesis 2 hexose transport sodium ion transport polyamine transport nucleocytoplasmic transport ribosome/RNA biogenesis ribosomal proteins translational elongation protein folding secretion protein glycosylation vesicle-mediated transport proteasome vacuole fusion mitoribosome/respiration Mitochond. electron trans. iron transport/TCA cycle Chromatin/transcription histones MCM2/3/6/CDC47 DNA replication mitotic cell cycle CLB1/CLB6/BBP1 cytokinesis development pheromone response conjugation sporulation/meiosis response to oxidative stress stress/heat shock Sample genes TRP4, HIS3 ARG1, ARG3 CAR1, CAR2 ARO9, ARO10 ASN1, ASN2 ILV1,2,3,6 LYS2, LYS9 MET3,16,28 MUP1, MHT1 ADE1,4,8 AAD4,14,16 BIO3,4 CIT1,2 ERG1,5,11 FAS1,FAS2 PGK1, TDH1,2,3 BNA4,6 GCV1,2,3 SNO1, SNZ1 THI5,12 THI2,20 HXT4,GSY1 ENA1,2,5 TPO2,3 KAP123,NUP100 MAK16,CBF5 RPS1A,RPL28 TEF1,2 SSA1,HSP60 VTH1,KRE11 ALG6,CAX4 VPS5,IMH1 RPN6,RPT5 VTC1,3,4,PHO84 MRPL1,MRPS5 ATP1,COX4 FRE1,FET3 SNF2,CHD1,DOT6 HTA1,HHF1 MCM2,3,6 RFA1,POL12 SPC110,CIN8 CLB1,6 CTS1,EGT2 PAM1,GIC2 FUS3,FAR1 CIK1,KAR3 SPO11,SPO19 GDH3,HYR1 HSP104,SSA4 Candidate regulator GCN4 ARG80/81 ARG80/81/UME6/RPD3 ARO80 GCN4/HAP1/HAP2 LEU3, GCN4 LYS14 CBF1, MET28, MET32 MET31,MET32 BAS1, BAS2, GCN4 RTG3 ECM22/UPC2 INO4 GCR1 THI2/THI3 THI2/THI3 GCR1 NRG1,MIG1 HAA1 RRPE-binding factor PAC/RRPE-binding factors HAC1,ROX1 RLM1 XBP1 RPN4 PHO4 HAP2/3/4/5 MAC1/RCS1/AFT1/PDR1/3 HIR1,HIR2 ECB MCB HCM1 FKH1 ACE2,SWI4 MATALPHA2,STE12 KAR4 NDT80 ROX1,MSN2,MSN4 MSN2,MSN4 424 experiments 249 genes 1,226 genes Chua et al., 2004
Analyzing clusters: amino acid biosynthesis (p<10-14)** amino acid metabolism (p<10-14)** methionine metabolism (p=1.07×10⁻⁷) **When testing clusters against many different types of categorical annotations, should consider correcting for multiple-testing, and also consider that categories are often not independent