Download
1 / 62
630 likes | 802 Vues
Vulnerable children: Can administrative data be used to identify vulnerable children at risk of adverse outcomes ?. Rhema Vaithianathan University of Auckland. Project Outline. September 2012 : Team reported to MSD on the feasibility of using PRM for identifying Vulnerable Children.

E N D
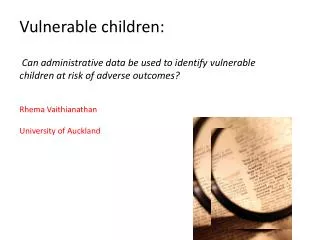
Vulnerable children:Can administrative data be used to identify vulnerable children at risk of adverse outcomes? Rhema Vaithianathan University of Auckland
Project Outline September 2012: Team reported to MSD on the feasibility of using PRM for identifying Vulnerable Children. • Feasible • Needs to look at widening beyond beneficiaries • Ethics of PRM
White Paper for Vulnerable Children • Released 11 October • Announced that more feasibility work would be undertaken on PRM to see if it could be trialed
Feasibility Project Outline December 2012 – November 2013: • Tim Dare looked at Ethics of PRM • MSD looked at broadening the scope beyond beneficiary data • Māori reference group to report on ethical issues from a Māori perspective • AEGIS group (chaired by Sir AnandSatyanand) overseeing the project and will advise the Minister
Future • AEGIS has to report to Minister • Decisions have to be made on whether it should be trialed
Today’s Talk • Based on the early feasibility work we did • Vaithianathan, R., Maloney, T., Putnam-Hornstein, E., & Jiang, N. (2013). Children in the public benefit system at risk of maltreatment: Identification via predictive modeling. American journal of preventive medicine, 45(3), 354-359.
What is Predictive Risk Modeling? Automaticrisk scoring tool which generates a “vulnerability score” based on the risk of an adverse event and large administrative dataset
Study Population The child is born between January 2003 and June 2006 ... AND
…identified with a family that has had a benefit spell begin between the child’s birth and 2nd birthday
Core Scoring Algorithm Applied at start of a spell for child under 2 years Predicts their vulnerability to a maltreatment finding by age 5 birth 2 yrs 5yrs
Developing the Algorithm • There are 103,397 spells (57,986 unique children) • Randomly split into 70% prediction sample and 30% development sample • Probit regression with backward stepwise selection (p>0.20) • 224 variables included • final model had 132 variables
Objective of this Project Can PRM be used to identify children (and pre-births) vulnerable to a finding of maltreatment? What are the practical issues to doing this?
Maltreatment is a substantiated finding of EMOTIONAL NEGLECT PHYSICAL or SEXUAL ABUSE By age 5 Finding is only a subset of actual incidence due to under-reporting
Baseline • 5.4% of all children (born between 2003 and 2006) have a maltreatment finding by age 5 • Of children seen on a benefit by age 2, 13% have a substantiated maltreated by age 5
Baseline • Of children seen on a benefit by age 2 • What proportions had finding of neglect, physical or sexually abuse, or emotional abuse • By age 5?
Baseline 10 times the risk of breast cancer in women aged 50-60* Source: Richardson, Cox and Small (2005), NZMJ, vol 118
Baseline Of all children born in New Zealand between January 2003 and June 2006 one-in-three are seen on a main benefit by age 2 Sole Parents, Unemployment, Sickness, Invalids
Baseline Of all children born between 1/03 and 06/06 who had a substantiated maltreated by age 5 83% were seen on benefits before age 2
Age at start of spell Most start their spell at or before birth
Children who start their spell at or before birth… tend to be more vulnerable
Child’s age at start of earliest spell and outcomes 18% of those who register at birth have a substantiated finding
… of all children with substantiated finding by age 561% arrived …on the benefit at birth or pre-birth
How Good is the Algorithm? Does it predict strongly? Is it correlated with other adverse events? NNT (Numbers Needed to Treat) Business Case
Strength of Prediction of Core Model is Reasonable… • Area under the ROC curve is 0.77 • 77% of the time, a maltreated child will have a higher score than a non-maltreated child • Similar to predictive power of mammogram
… rate of substantiated findings correlated to vulnerability score baseline Vulnerability Score (1st spell)
Halfof children with a score of 10 have finding by age 5 baseline Vulnerability Score (1st spell)
… 2% of children with a score of 1 baseline Vulnerability Score (1st spell)
… never seen on a benefit have a rate of 1.4% baseline 1.4% Vulnerability Score (1st spell)
… and is correlated with other substantiated findings Vulnerability Score (1st spell)
what proportion of finding will be “identified”? (Based on score of the first spell)
Targeting those scoring 9 or 10 will capture about 40 - 50 % of all adverse findings that occur to children on the benefit
44% of children who have a finding by age 5 and on a benefit by age 2 will be scored a 9 or 10
Numbers Needed to Treat (NNT) 20,671 children start a spell aged less than 2 p.a. Suppose we offered services to those in the those scoring 8,9 or 10
Numbers Needed to Treat (NNT) (to avoid onemaltreatment finding)
NNT for statins as secondary prevention is around 30* *Source: J R Soc Med. 2004 October; 97(10): 461–464 Thompson and Temple.
Business Case Consider a Nurse Visitation Programme Nurse visits weekly for 1 hour for first 2 years of child’s life Evidence is that it reduces maltreatment risk by 46% Assume 50% take-up Suppose nurse paid $75,000 p.a. Does 5 visits per day Has 4 weeks’ holiday 10 weeks p.a. continuing education
We estimate a cost of $8,210 per child over 2 years Similar to cost of NFP in England (£3,000 p.a.) We can show the cost-effectiveness of reducing maltreatment Back of the envelope calculations Warning: Illustrative only
46% efficacy offered to vulnerable families with a score of 9 or 10
A 46% effective program with a 50% take up targeted to the top 20% reduces maltreatment amongst all under 5 years old children in New Zealand by 8.3% (at a cost of $13.5m)