Analysis of Genes Induced by E2 and 4-NP: A Comprehensive Study
Explore the gene expression changes induced by E2 and 4-NP treatments using microarray and RT-PCR analyses. The study includes hierarchical clustering, heat maps, scatterplots, and validation of gene expression profiles related to estrogen signaling. Investigate the impact of E2 and 4-NP on specific genes like ESR2, BRCA1, and BRCA2.

Analysis of Genes Induced by E2 and 4-NP: A Comprehensive Study
E N D
Presentation Transcript
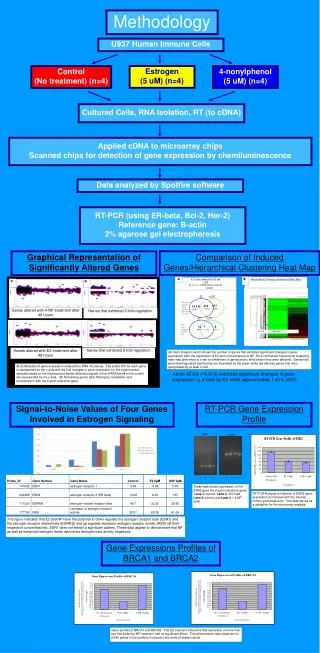
A B • # Of Genes Induced By E2 and • 4-NP • by a > or = 2-Fold Change from the • Control Hierarchical Clustering Normalized Heat Map E2 4-NP All genes from the whole- genome nanochips (33,155) 633 (1.9%) 414 (1.2%) 14,913 (45.0%) E2 4-NP Genes from customized portfolio (90) 54 (60.0%) 8 (8.9%) 7 (7.8%) E2 (5uM) 4-NP (5uM) Relative Gene Expression (Signal of treatment chip/signal of chip treatment) Relative Gene Expression (Signal of treatment chip/signal of chip treatment) Methodology U937 Human Immune Cells Estrogen (5 uM) (n=4) Control (No treatment) (n=4) 4-nonylphenol (5 uM) (n=4) Cultured Cells, RNA Isolation, RT (to cDNA) Applied cDNA to microarray chips Scanned chips for detection of gene expression by chemiluminescence Data analyzed by Spotfire software RT-PCR (using ER-beta, Bcl-2, Her-2) Reference gene: B-actin 2% agarose gel electrophoresis Comparison of Induced Genes/Hierarchical Clustering Heat Map Graphical Representation of Significantly Altered Genes B A B Genesalteredwith 4-NP treatmentafter 48 hours Genesthatexhibited 2-foldregulation Genesthatexhibited 2-foldregulation Genesalteredwith E2 treatmentafter 48 hours (A) Venn Diagram which shows the number of genes that exhibited significant changes in gene expression after the application of E2 and concentrations of NP. (B) A normalized hierarchical clustering heat map performed in order to similarities of genes and to what extent they were affected. Genes that were downregulated significantly are illustrated by the green while red denotes genes that were upregulated by at least 2-fold. A) Scatterplots of gene expression analyzed by DNA microarray. The probe ID’s for eachgeneisrepresented by the x-axis and the fold changes in gene expression for the experimentalsamplesbased on the fluorescence-baseddetectionsignals of the mRNAlevels in the control are represented by the y-axis. (B) Remaininggenesafterfiltering by modulation and normalizationwith the b-actinreferencegene. About 45.0% (14,913) exhibited significant changes in gene expression (> 2-fold) by E2 while approximately 1.91% (633) RT-PCR Gene Expression Profile Signal-to-Noise Values of Four Genes Involved in Estrogen Signaling ESR2 β-actin 1 2 3 4 1 2 3 4 These gels exhibit expression of the ESR2 gene the β-actin reference gene. Lane 1=control, Lane 2 =E2 5uM, Lane 3=control and Lane 4 = 4-NP 5uM. RT-PCR Analysis of Intensity of ESR2 gene expression normalized with the internal control gene beta-actin. This data serves as a validation for the microarray analysis. This figure indicates that E2 and NP have the potential to down regulate the estrogen receptor beta (ESR1) and the estrogen receptor related beta (ESRR-β) and up regulate repressor estrogen receptor activity (REA) (at their respective concentrations). ESR1 does not exhibit a significant pattern. These data appear to demonstrate that NP as well as enhanced estrogen levels diminishes estrogen beta activity negatively. Gene Expressions Profiles of BRCA1 and BRCA2 Gene profiles of BRCA1 and BRCA2. The E2 treament induced a fold repression of more than two fold while the NP treatment had no significant effect. This phenomenon was observed for 23/45 genes in the portfolio involved in the onset of breast cancer.