Download
1 / 33
330 likes | 515 Vues
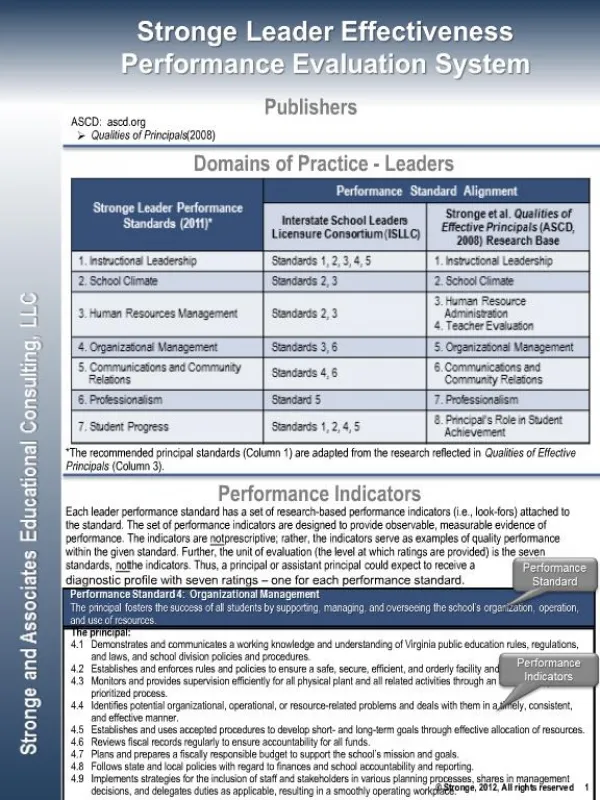
Teacher and Leader Effectiveness Performance Evaluation System. Stronge and Associates Educational Consulting, LLC. Dr. Ginny Tonneson. Why is effectiveness so important?. Dallas Research: Teacher Quality. 4 th Grade Math Achievement. Dallas, Texas data: 2800-3200 students per cohort

E N D
Teacher and Leader Effectiveness Performance Evaluation System Stronge and Associates Educational Consulting, LLC Dr. Ginny Tonneson
Dallas Research: Teacher Quality 4th Grade Math Achievement Dallas, Texas data: 2800-3200 students per cohort Comparison of 3 “highly effective” & 3 “ineffective” teachers (Jordan, Mendro, & Weerasinghe, 1997)
Dallas Research: Teacher Quality 4th Grade Reading Achievement Dallas, Texas data: 2800-3200 students per cohort Comparison of 3 “highly effective” & 3 “ineffective” teachers (Jordan, Mendro, & Weerasinghe, 1997)
Sequence of Effective Teachers Low Low Low 52-54 percentile points difference High High High Sanders & Rivers, 1996
Sequence of Effective Teachers High Low Low 13 percentile points difference High High High Sanders & Rivers, 1996
Residual Effect Two years of effective teachers could not remediate the achievement loss caused by one year with a poor teacher. Mendro, Jordan, Gomez, Anderson, & Bembry (1998)
75th Percentile Teacher 25th Percentile Teacher 0 1/4 1/2 3/4 1 Years Needed Time in School Year Needed to Achieve the Same Amount of Learning Leigh, A. (n.d.). Estimating teacher effectiveness from two-year changes in students’ test scores.Retrieved from http://econrsss.anu.edu.au/~aleigh/.
90th Percentile Teacher 10th Percentile Teacher 0 1/4 1/2 3/4 1 Years Needed Time in School Year Needed to Achieve the Same Amount of Learning Leigh, A. (n.d.). Estimating teacher effectiveness from two-year changes in students’ test scores. Retrieved from http://econrsss.anu.edu.au/~aleigh/.
Annual Student Achievement Gains Barber, M., & Mourshed, M. (2007). How the world’s best-performing school systems come out on top. London: McKinsey & Company. Retrieved from http://www.mckinsey.com/locations/ukireland/publications/pdf/ Education_report.pdf; Stronge, J.H., Ward, T.J., Tucker, P.D., & Grant, L.W., in preparation
Effectiveness is the goal. Evaluation is merely the means. Stronge Evaluation System
Key Features • Uniform evaluation system for teachers, educational specialists, & principals • Camera-ready handbooks and training materials • Simplified set of research-based performance standards • Extensively field tested • Aligned with InTASC and ISLLC standards • Professional growth and accountability oriented • Multiple data sources • Includes measures of student progress • Provides diagnostic profile of evaluatee • Fully customizable to district and state requirements
Main Components Performance Standard Performance Indicators Performance Appraisal Rubric
Forms • Specific forms for teachers, educational specialists, and principals • Numerous optional forms (self-assessment, communication log, professional development log, interim performance evaluation, specific focus of observation) • Straight-forward, easy to use • Customizable to meet individual district and state requirements • Available in hard-copy or via MyLearningPlan® OASYSTM
Grade Inflation Chicago: 2003-04 – 2007-08 Superior 25,332 Excellent 9,176 Satisfactory 2,232 Unsatisfactory 149 New Teacher Project, Widget Effect, 2009
Sample Summative Evaluation Form (abbreviated) Performance Standard 1: Professional Knowledge
Student Progress (Standard 7) • Uses selected growth measures (e.g., student growth percentiles, value-added models) • Uses multiple alternative measures (e.g.,student learning objectives, student achievement goal setting) • Standard accounts for larger percentage of summative score than other standards (e.g., 40% or 50%)
Training in Stronge Evaluation System • Requirements • Evaluators: three days • Teachers: two days • Follow-up on-site training during academic year, as applicable • Methods • Direct instruction • Application activities • Video simulations • Discussion groups • Format • Direct training in central location • Regional training with multiple school districts • On-site training for selected school districts • Train-the-trainers option
Training (cont.) • Options for Certification of Evaluators • Following initial training in content and process • Inter-rater reliability training • Costs • See handout
OutstandingTeachers & Leaders = Student Results Focus on Effectiveness
Teacher and Leader Effectiveness Performance Evaluation System James H. StrongeJames.Stronge@gmail.com757.880.3881 Stronge and Associates Educational Consulting, LLC