Download
1 / 81
830 likes | 1.13k Vues
Mass Spectroscopy. Alireza Ghassempour (PhD) Medicinal Plants and Drugs Research Institute Shahid Beheshti University Evin, Tehran. Operational sequence. separate by mass/charge. introduce sample. detect ions. ionize. Sample introduction. Ionization methods.

E N D
Mass Spectroscopy Alireza Ghassempour (PhD) Medicinal Plants and Drugs Research Institute Shahid Beheshti University Evin, Tehran
Operational sequence separate by mass/charge introduce sample detect ions ionize
Ionization methods EI – direct interaction of electrons with sample CI – electrons ionize reagent gases DI – uses a pulse of energy to produce ions SI – converts solvated molecules into ions
electron ionization There will be different degrees of fragmentation depending on the stability of the sample molecule For a stable aromatic compound the primary peak is the parent ion For a less stable cyclic compound fragmentation is predominant
Chemical ionization Chemical ionization is a more controlled method of ionization than electron ionization In CI a neutral analyte (M) reacts with a reagent ion that is generated by EI to form a variety of molecular ions *
Desorption ionization • Energetic primary ions • secondary ion mass spectrometry (SIMS) • Energetic atoms • fast atom bombardment (FAB) • Nuclear fission fragments • plasma desorption (PD) • Photons • laser desorption (LD) • Very rapid heating • desorption chemical ionization (DCI)
FAB ionization matrices • Optimal matrix properties • Strongly absorbs the energy provided • Contributes few ions to the spectrum • Interacts with the analyte to produce ions • Effectively transfers energy to the analyte ions
Diagram of an FAB gun. 1, Ionization of argon; the resulting ions are accelerated and focused by the lenses 2. In 3, the argon ions exchange their charge with neutral atoms, thus becoming rapid neutral atoms. As the beam path passes between the electrodes 4, all ionic species are deflected. Only rapid neutral atoms reach the sample dissolved in a drop of glycerol, 5. The ions ejected from the drop are accelerated by the pusher, 6, and focused by the electrodes, 7, towards the analyser, 8.
Depending on the nature of the matrix we can obtain different molecular ions Why are there two peaks? 107Ag and 109Ag Ag salt deprotonated species protonated species
Spray ionization methods Spray ionization achieves the direct conversion of non-volatile, solvated molecules into gas phase ions
Electrospray ionization ESI-MS of cytochrome c (mw = 12,360) peak separation is 1/15 The isotope distribution also allows charge assignment, since each isotopic peak is separated from the next by 1/n where n is the charge
Principles of MALDI • The sample is dispersed in a large excess of matrix material which will strongly absorb the incident light. • The matrix contains chromophore for the laser light and since the matrix is in a large molar excess it will absorb essentially all of the laser radiation • The matrix isolates sample molecules in a chemical environment which enhances the probability of ionization without fragmentation • Short pulses of laser light (UV, 337 nm) focused on to the sample spot cause the sample and matrix to volatilize • The ions formed are accelerated by a high voltage supply and then allowed to drift down a flight tube where they separate according to mass • Arrival at the end of the flight tube is detected and recorded by a high speed recording device
Sample Preparation: Dried Droplet solved sample solved Matrix Mixing and Drying
Sample Preparation: Thin Layer solved Matrix thin homogenuous fast layer of crytslas drying solved sample Drying
MALDI spectra of a monoclonal antibody (above) and of a polymer PMMA 7100 (below).
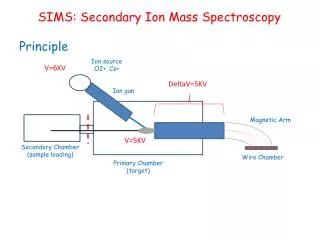
Secondary ion generation • The sample is prepared in an ultra high vacuum. • A beam of primary ions or neutral particles impacts the surface with energies of 3-20 keV. • A primary ion or particle causes a collision cascade amongst surface atoms and between .1 and 10 atoms are usually ejected. This process is termed sputtering. The sputter yield depends on the nature of the analyte.
Static SIMS • Low ion flux is used. This means a small amount of primary ions is used to bombard the sample per area per unit time. Sputters away approximately only a tenth of an atomic monolayer. • Ar+, Xe+, Ar, and Xe are the commonly used particles present in the primary particle beam, which has a diameter of 2-3 mm. • The analysis typically requires more than 15 minutes. • This technique generates mass spectra data well suited for the detection of organic molecules.
Imaging SIMS • The mass spectrometer is set to only detect one mass. • The particle beam traces a raster pattern over the sample with a low ion flux beam, much like Static SIMS. • Typical beam particles consists of Ga+ or In+ and the beam diameter is approximately 100 nm. • The analysis takes usually less than 15 min. • The intensity of the signal detected for the particular mass is plotted against the location that generated this signal. • Absolute quantity is difficult to measure, but for a relatively homogeneous sample, the relative concentration differences are measurable and evident on an image. • Images or maps of both elements and organics can be generated.
Images created using the Imaging SIMS mode. Scanning ion image of granite from the Isle of Skye. -University of Arizona SIMS 75 x 100 micrometers.
Mass Analyzer divided into: 1. Scanning analysers transmit: 1.1 only the ions of a given mass-to-charge ratio to go through at a given time (magnetic, qudrupole) 1.2. allow the simultaneous transmission of all ions (ion trap, TOF) 2. ion beam versus ion trapping types, 3. continuous versus pulsed analysis, 4. low versus high kinetic energies
The five main characteristics for mass analyser: 1. The mass range limit (Th) 2. The analysis speed (u s−1) 3. The transmission (the ratio of the number of ions reaching the detector and the number of ions entering the mass analyser, a quadrupole MS used in SIM mode has a duty cycle of 100 % but a quadrupole MS scanning over 1000 amu, the duty cycle is 1/1000=0.1%. ) 4. The mass accuracy (ppm) 5. The resolution.
Two peaks are considered to be resolved if the valley between them is equal to 10% of the weaker peak intensity when using magnetic or ion cyclotron resonance (ICR) instruments and 50% when using quadrupoles, ion trap, TOF, and so on. R=m/∆m Low resolution or high resolution is usually used to describe analysers with a resolving power that is less or greater than about 10 000 (FWHM), respectively
The first example is human insulin, a protein having the molecular formula C257H383N65O77S6. The nominal mass of insulin is 5801 u using the integer mass of the most abundant isotope of each element, such as 12 u for carbon, 1u for hydrogen, 14 u for nitrogen, 16 u for oxygen and 32 u for sulfur. Its monoisotopic mass of 5803.6375 u is calculated using the exact masses of the predominant isotope of each element such asC=12.0000 u, H=1.0079 u, N=14.0031 u, O=15.9949 uand S=31.9721 u.
Monoisotopic mass / Average Mass Average mass Monoisotopic mass
Magnetic-Sector THEORY: The ion source accelerates ions to a kinetic energy given by: KE = ½ mv2 = qV Where m is the mass of the ion, v is its velocity, q is the charge on the ion, and V is the applied voltage of the ion optics.
Magnetic-Sector • The ions enter the flight tube and are deflected by the magnetic field, B. • Only ions of mass-to-charge ratio that have equal centripetal and centrifugal forces pass through the flight tube: • mv2 /r = BqV, where r is the radius of curvature
Magnetic-Sector • mv2 /r = BqV • By rearranging the equation and eliminating the velocity term using the previous equations, r = mv/qB = 1/B(2Vm/q)1/2 • Therefore, m/q = B2r2/(2V) • This equation shows that the m/q ratio of the ions that reach the detector can be varied by changing either the magnetic field (B) or the applied voltage of the ion optics (V).
Basis of Quadrupole Mass Filter • consists of 4 parallel metal rods, or electrodes • opposite electrodes have potentials of the same sign • one set of opposite electrodes has applied potential of [U+Vcos(ωt)] • other set has potential of - [U+Vcosωt] • U= DC voltage, V=AC voltage, ω= angular velocity of alternating voltage
The trajectory of an ion will be stable if the values of x and y never reach r0, thus if it never hits the rods. To obtain the values of either x or y during the time, these equations need to be integrated. The following equation was established in 1866 by the physicist Mathieu :
Mass analyzers An ion trap is a device that uses an oscillating electric field to store ions. The ion trap works by using an RF quadrupolar field that traps ions in two or three dimensions (2D and 3D).
Ion Trap MS • Ions are trapped by applying rf frequencies on the ring electrode and endcaps • Then ions are scanned out of the trap by m/z as the base mass voltage is increased over time • This is accomplished by maintaining in the trap a pressure of helium gas which removes excess energy from the ions by collision.
Time of Flight Schematic • The Back Plate and Grid are used to accelerate the ions • The Ion source is used to ionize the Sample • The Sample Inlet introduces the sample to the source • The vacuum is used to maintain a low pressure • The Drift Region separates the ions according to their mass • The Detector outputs current as each ion strikes it • The Oscilloscope displays the detector output
Time-of-Flight Converted to Mass • An accelerating potential (V) will give an ion of charge z an energy of zV. This can be equated to the kinetic energy of motion and the mass (m) and the velocity (v) of the ion • zV = 1/2mv2 • Since velocity is length (L) divided by time (t) then • m/Z = [2Vt2]/L2 • V and L cannot be measured with sufficient accuracy but the equation can be rewritten • m/Z = B(t-A)2 where A and B are calibration constants that can be determined by calibrating to a known m/Z
Reflectron TOF-MS Improved mass resolution in MALDI TOF-MS has been obtained by the utilization of a single-stage or a dual-stage reflectron (RETOF-MS). The reflectron, located atthe end of the flight tube, is used to compensate for the difference in flight times of the same m/z ions of slightly different kinetic energies by means of an ion reflector. This results in focusing the ion packets in space and time at the detector
A typical MALDI mass spectrum of substance P in CHCA (see Table 1) employing both linear and reflectron TOF-MS in the continuous ion extraction mode with a 500 MS/s transient digitizer is shown. The maximum mass resolution observed in the linear mass spectrum of substance P employing continuous ion extraction is about 600 which is typical for a peptide of this size. Only the average chemical mass can be determined from this mass spectrum. In the reflectron mass spectrum, the isotopic multiplet is well resolved producing a full width half maximum (FWHM) mass resolution of about 3400
FTICR: New Dimensions of High Performance Mass Spectrometry Ions are trapped and oscillate with low, incoherent, thermal amplitude Excitation sweeps resonant ions into a large, coherent cyclotron orbit Preamplifier and digitizer pick up the induced potentials on the cell.
FTICR: New Dimensions of High Performance Mass Spectrometry The frequency of the cyclotron gyration of an ion is inversely proportional to its mass-to-charge ratio (m/q) and directly proportional to the strength of the applied magnetic field B.
Detection electrodes Time Time + Intensity [%] 0 Excitation electrodes Fourier Transform Frequency Fourier Transform Ion Cyclotron Resonance Mass Spectrometry + Fourier Transform MS spec with only one frequency
High Resolution of FTICR MS Ubiquitin (14+) Mass resolution: 170,000 (up to 5,000,000)