Glucose Control: What, Why, When, and How
850 likes | 1.02k Vues
Glucose Control: What, Why, When, and How. Terry P. Clemmer, MD Salt Lake City, Utah. What Are The Options?. No Glucose Control Some Glucose Control with Target <250 mg/dl (14 mMol) Moderate Glucose Control with Target <150 mg/dl (8.3 mMol)

Glucose Control: What, Why, When, and How
E N D
Presentation Transcript
Glucose Control:What, Why, When, and How Terry P. Clemmer, MD Salt Lake City, Utah Glucose Control NYNY
What Are The Options? • No Glucose Control • Some Glucose Control with Target <250 mg/dl (14 mMol) • Moderate Glucose Control with Target <150 mg/dl (8.3 mMol) • Tight Glucose Control with Target 80-110 mg/dl (4.4 - 6.1 mMol) Glucose Control NYNY
What: Define Tight Glucose Control • Blood Glucose Is Controlled with > 40% of the Values Between 80-110 mg/dl • Over 80% of Values Are Between 60-150 mg/dl • The Hypoglycemia Rate (<60) Is Acceptable and Near Routine Practice • The Severe Hyperglycemia Rate (>250) is Acceptable and Below Routine Practice Glucose Control NYNY
Intermountain: 9 Facilities 13 ICUs Glucose Control NYNY
Why: The Evidence • Van den Berghe. N Engl J Med 2001;345:1359- 67 • Van den Berghe, Crit Care Med 2003 • Finney et al. JAMA 2003 • Krinsley. Mayo Clin Proc 2004 • Van den Berghe. N Engl J Med 2006 • Brunkhorst et al. 2008 Glucose Control NYNY
Hypothesis • Hyperglycemia, Relative Insulin Deficiency or Both During Critical Illness May Confer a Predisposition to Complications: • Severe Infections • Polyneuropathy • Multi-organ Failure • Death Glucose Control NYNY
Entrance Criteria • ICU Admission Requiring a Ventilator • Written Informed Consent • Dates Feb 2, 2000 - Jan 18, 2001 Glucose Control NYNY
Enrollment • 1548 Patients Enrolled • 783 Conventional Rx • 765 Intensive Insulin Rx • 14 Excluded • 5 Participating in Other Trials • 9 Moribund on Admission With DNR Orders Glucose Control NYNY
Randomization • Sealed Envelopes • Stratification According to Type of Critical Illness • Balance With Permuted Blocks of 10 Glucose Control NYNY
Study Design • Conventional Group • Insulin Started Only If Serum Glucose > 215 mg/dl • Insulin Adjusted to Keep Gluucose @ 180-200 mg/dl • Feed 20-30 NPKcal / day with 20-40% Fat Glucose Control NYNY
Study Design • Intensive Rx Group • Insulin Started If Serum Glu. > 110 mg/dl • Insulin Adjusted to Keep Glu. @ 80-110 mg/dl • Max Insulin Dose 50 Units Per Hour • Whole Blood Glu. Measure Q1-4 Hours Glucose Control NYNY
Study Design • Intensive Rx Group • Adjustments Made Using an Algorithm by a Team of CC Nurses Assisted by a Study Physician Not Caring For the Patients • Upon Unit Discharge Study Patients Were Rx According to Conventional Protocol (180-200) • Feed 20-30 NP-Kcal / day with 20-40% Fat Glucose Control NYNY
Characteristic Conventional Intensive Number 783 765 Gender Male 557 (71%) 554 (71%) Age 62.2 63.4 BMI 25.8 26.2 Reason for ICU Care Cardiac Surg 493 (63%) 477 (62%) Non-Cardiac Surg. 290 (37%) 288 (38%) Neuo/Neuro Surg 30 (4%) 33 (4%) Resp. Fail / Thor. Surg 56 (7%) 66 (9%) Abdominal Surg. 58 (7%) 45 (6%) Vasc. Surg. 32 (4%) 30 (4%) Trauma/Burns 35 (4%) 33 (4%) Transplantation 44 (6%) 46 (6%) Other 35 (4%) 35 (5%) Population Demographics Glucose Control NYNY
Characteristic Conventional Intensive APACHE II 9 9 TISS-28 43 43 Tertiary Referral 135 (17%) 126 (16%) Hx of Cancer 119 (15%) 122 (16%) Hx of Diabetes 103 (13%) 101 (13%) Rx with Insulin 33 (4%) 39 (5%) Rx w/o Insulin 70 (9%) 62 (8%) FBG > 110 598 (76%) 557 (73%) FBG > 200 110 (13%) 81 (11%) Population Demographics Glucose Control NYNY
Variable Conventional Intensive Adm of Insulin 307 (39.2%) 755 (98.7%) Insulin Dose Median 33 u/day 71 u/day Duration of Insulin Median 67% of days 100% of days AM Blood Glucose All Patients 153+33 mg% 103+19 mg% Rx with Insulin 173+33 mg% 103+18 mg% Incidence of Glu. < 40 mg% 6 (0.78%) 39 (5%) P-value for all variables <0.001 Control of Blood Glucose Glucose Control NYNY
p- value Variable Conventional Intensive 0.04 All ICU Deaths 63/783 (8%) 35/765 (4.6%) 0.9 During 1st 5 days 14/783 (1.8%) 13/765 (1.7%) 49/243 (20.2%) 22/208 (10.6%) 0.005 > 5 days ICU care Hosp. Deaths 0.01 All Patients 85/783 (10.9%) 55/765(7.2%) 0.01 64/243 (26.3%) 35/208 (16.8%) > 5 days ICU care 10/477 (2.1%) Cardiac Surg. 25/493 (5.1%) Non-Cardiac Neuo/Neuro Surg 7/30 (23.3%) 6/33 (18.2%) Resp. Fail / Thor. Surg 10/56 (17.9%) 5/66 (7.6%) Abdominal Surg. 9/58 (15.5%) 6/45 (13.3%) Vasc. Surg. 2/32 (6.2%) 2/30 (6.7%) Trauma/Burns 3/35(8.6%) 4/33 (12.1%) Transplantation 1/44 (2.3%) 2/46 (4.4%) Other 6/35 (17.1%) 0/35 Mortality Glucose Control NYNY
Conventional Intensive Variable Rx Rx p-value ICU - LOS All Pts 3 (2-9) 3 (2-6) 0.2 <5 days 2 (2-3) 2 (2-3) 0.2 > 5 days 15 (9-27) 12 (8-20) 0.003 > 14 days 126 (15%) 87 (11%) 0.01 Vent. Days All Pts 2 (1-6) 2 (1-4) 0.06 <5 days 1 (1-2) 1 (1-2) 0.9 > 5 days 12 (7-23) 10 (6-16) 0.006 > 14 days 93 (11.9%) 57 (7.5%) 0.003 Renal Failure Creat. > 2.5 96 (12.3%) 69 (9%) 0.04 BUN > 54 88 (11..2%) 59 (7.7%) 0.02 Dialysis 64 (8.2%) 37 (4.8%) 0.007 Sepsis Pos. Culture 61 (7.8%) 32 (4.2%) 0.003 Abx > 10 d 134 (17.1%) 86 (11.2%) 0.001 Polyneuropathy Any 107/206 (51.9%) 45/157 (11.2%) 0.001 Twice 39/206 (18.9%) 11/157 (7%) 0.001 Morbidity Glucose Control NYNY
Not All Evidence is Created Equal... Population • Med/Surgical ICU patients Methods • Prospective observational study (n= 531) Analysis • Logistic regression • Exposure: insulin dose and glucose range • Adjustment: APACHE II, SOFA score, age, sex, BMI, admission dx, ICU LOS Outcome: mortality Finney et al. JAMA 2003 Glucose Control NYNY
Outcomes Conclusion: Target blood glucose < 145 mg/dl Finney et al. JAMA 2003 Glucose Control NYNY
Intensive Glucose Management in Critically Ill Adult Patients Population • 14-bed Med/surg ICU at a university-affiliated community teaching hospital Intervention: protocol (target < 140 mg/dl) • Before protocol (n= 800) • glucose mean = 152.3 • After protocol (n= 800) • glucose mean = 130.7 • 56% reduction in % glucose >200 mg/dl Krinsley. Mayo Clin Proc 2004 Glucose Control NYNY
Intensive Glucose Management in Critically Ill Adult Patients Outcomes • Decreased new renal failure: 75% (p=0.03) • Decreased ICU LOS: 11% (p=0.01) • Decreased hospital mortality: 29% (p=0.002) • Hypoglycemia (< 60 mg/dl): 0.54 to 1.02% • Hypoglycemia (< 40 mg/dl): 0.34 to 0.35% Krinsley. Mayo Clin Proc 2004 Glucose Control NYNY
Entrance Criteria • Patient Expected to Be in ICU > 3-days • Patients Expected to Be NPO > 3-days Glucose Control NYNY
64% Glucose Control NYNY
P=0.31 P=0.005 P=0.31 P=0.05 Glucose Control NYNY
Hypoglycemia Glucose Control NYNY
Intermountain Computer Controlled Tight Glucose Control Glucose Control NYNY
If The Hypoglycemia Rate Is Unacceptable, Is the Definition of Tight Glucose Control Fulfilled? Glucose Control NYNY
When:And At What Level Is Tight Control Appropriate • What Are The Units Resources • How often can glucose monitoring be done • How skilled are the nurses at using the glucose protocol • How unstable are the patients glucoses • Should It Only Be After 3-days in the ICU • Is < 150 as Beneficial as 80-110 • What Are the Hypoglycemia Risks Glucose Control NYNY
Conclusions • Glucose Should Be Controlled at Some Level • The Leuven Protocol Used Blindly and Broadly Results In Unacceptable Hypoglycemia • The Leuven Protocol Should Not Be Used Unless Modified and Tested for safety and Effectiveness In the Local Environment Glucose Control NYNY
Conclusions • Exact Range for Maximal Benefit at Lowest Risk Should Be Determined • It Depends Upon Units Resources • It is Dependent on Local Protocol Implementation • Glucose Control Should Be Done at the Local Level Glucose Control NYNY
How: The Science of Implementation • Do It At The Front Line • Create a Protocol • Rapid Cycle Test the Protocol • Find the Problems and Learn Glucose Control NYNY
How The Science of Implementation • Modify the Protocol • Repeat the Process Until Protocol Is • Safe • Effective • Doable • Acceptable Glucose Control NYNY
AIM:What are we trying to accomplish. • MEASURE:How will we know the change is an improvement? • CHANGE CONCEPT: What change can we make that will result in an improvement? • TEST: Langley, Nolan, Nolan, Norman & Provost ‘ The Improvement Guide’ Act Plan Study Do IHI Model for Improvement Glucose Control NYNY
Example: AIM: Use an insulin drip protocol to achieve tight glucose control Glucose Control NYNY
Glucose Drip Rate of 1 - 3 u/h Drip Rate of 4 - 6 u/h Drip Rate of 7-10 u/h Drip Rate of 11-14 u/h Drip Rate of 15-18 u/h Drip Rate of >18 u/h < 41 mg/dl D/C Drip and Give 1 amp D/50 D/C Drip and Give 1 amp D/50 D/C Drip and Give 1 amp D/50 D/C Drip and Give 1 amp D/50 D/C Drip and Give 1 amp D/50 D/C Drip and Give 1 amp D/50 41-60 mg/dl D/C Drip and Give 1/2 amp D/50 D/C Drip and Give 1/2 amp D/50 D/C Drip and Give 1/2 amp D/50 D/C Drip and Give 1/2 amp D/50 D/C Drip and Give 1/2 amp D/50 D/C Drip and Give 1/2 amp D/50 61-80 mg/dl D/C Drip Decrease Drip Rate by one half Decrease Drip Rate by one half Decrease Drip Rate by one half Decrease Drip Rate by two thirds Decrease Drip Rate by two thirds 81-115 mg/dl Do Nothing / Don't tamper with success Do Nothing / Don't tamper with success Do Nothing / Don't tamper with success Do Nothing / Don't tamper with success Do Nothing / Don't tamper with success Do Nothing / Don't tamper with success Glucose Drip Rate of 1 - 3 u/h Drip Rate of 4 - 6 u/h Drip Rate of 7-10 u/h Drip Rate of 11-14 u/h Drip Rate of 15-18 u/h Drip Rate of > 18 116-140 mg/dl Give 1 u insulin IV push and increase Drip Rate by 1 unit/hour Give 1 u insulin IV push and increase Drip Rate by 2 unit/hour Give1 u insulin IV push and increase Drip Rate by 3 unit/hour Give1 u insulin IV push and increase Drip Rate by 4 unit/hour Give1 u insulin IV push and increase Drip Rate by 5 unit/hour Call Physician for New Order 141-180 mg/dl Give 2 u insulin IV push and increase Drip Rate by 1 unit/hour Give 2 u insulin IV push and increase Drip Rate by 2 unit/hour Give 2 u insulin IV push and increase Drip Rate by 3 unit/hour Give 2 u insulin IV push and increase Drip Rate by 4 unit/hour Give 2 u insulin IV push and increase Drip Rate by 5 unit/hour Call Physician for New Order 181-240 mg/dl Give 3 u insulin IV push and increase Drip Rate by 1 unit/hour Give 3 u insulin IV push and increase Drip Rate by 2 unit/hour Give 3 u insulin IV push and increase Drip Rate by 3 unit/hour Give 3 u insulin IV push and increase Drip Rate by 4 unit/hour Give 3 u insulin IV push and increase Drip Rate by 5 unit/hour Call Physician for New Order 241-300 mg/dl Give 5 u insulin IV push and increase Drip Rate by 1 unit/hour Give 5 u insulin IV push and increase Drip Rate by 2 unit/hour Give 5 u insulin IV push and increase Drip Rate by 3 unit/hour Give 5 u insulin IV push and increase Drip Rate by 4 unit/hour Give 5 u insulin IV push and increase Drip Rate by 5 unit/hour Call Physician for New Order 301-360 mg/dl Give 8 u insulin IV push and increase Drip Rate by 2 unit/hour Give 8 u insulin IV push and increase Drip Rate by 3 unit/hour Give 8 u insulin IV push and increase Drip Rate by 4 unit/hour Give 8 u insulin IV push and increase Drip Rate by 5 unit/hour Give 8 u insulin IV push and increase Drip Rate by 6 unit/hour Call Physician for New Order 361-420 mg/dl Give 10 u insulin IV push and increase Drip Rate by 2 unit/hour Give 10 u insulin IV push and increase Drip Rate by 3 unit/hour Give 10 u insulin IV push and increase Drip Rate by 4 unit/hour Give 10 u insulin IV push and increase Drip Rate by 5 unit/hour Give 10 u insulin IV push and increase Drip Rate by 6 unit/hour Call Physician for New Order >420 mg/dl Call Physician for New Order Call Physician for New Order Call Physician for New Order Call Physician for New Order Call Physician for New Order Call Physician for New Order LOOK UP TABLES FOR "AGGRESSIVE" INSULIN DRIP PROTOCOL Give 3 u insulin IV push and increase Drip Rate by 3 unit/hour Glucose Control NYNY
Plan Use an ‘adopted’ insulin drip protocol to control the glucose in ‘one’ hyperglycemic patient for “one” shift keeping the level between 60 and 150 mg/dl as measured at the bedside. Glucose Control NYNY
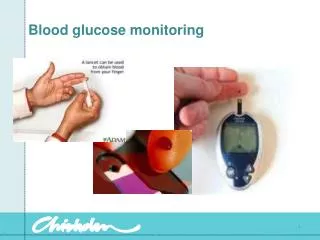
Do • Use the protocol on one patient • for one Shift • Record • insulin drip changes • amount and timing of insulin boluses • the blood glucose levels • the time the glucoses were done • Document whenever the protocol was not followed and the time and reason for the protocol violation. Glucose Control NYNY
Study • The protocol resulted in two incidents of mild hypoglycemia. • After the hypoglycemia the nurse violated the protocol when the glucose was dropping rapidly by reducing the incremental drip change and omitted bolus to avoid this complication. • The protocol was ambiguous in a few places that the nurse felt could lead to mistakes. • The protocol was very effective at reducing the glucose to below the 150 mg/dl range. Glucose Control NYNY