System Performance Analysis and Optimization for Passport and Ferry Services
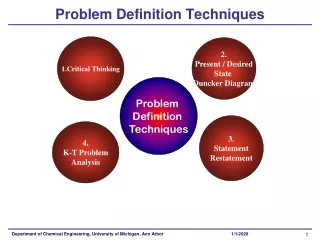
Analyze key object classes, actions, and performance indicators to address queue length, resource occupation, and future developments in passport and ferry services. Evaluate solutions, considering extreme cases and propose strategies for optimization.


System Performance Analysis and Optimization for Passport and Ferry Services
E N D
Presentation Transcript
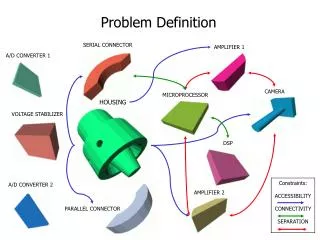
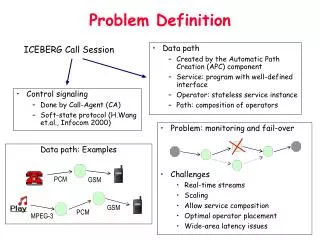
Scope Define what to study (and what not). Too much = wasted work! Key object classes (order, delivery, ...) and actions. Actions cause state change of objects. Necessary for understanding and modeling. Performance indicators (system time, resource occupation, cost, ...) Problems to be addressed Solution alternatives Account for expected future developments
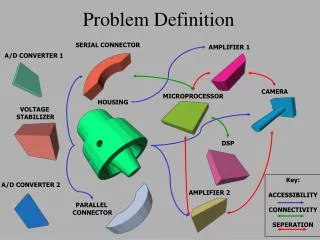
Objects and actions Objects have a life cycle, consisting of states. For example, for the passport case, citizen and civil servant objects do matter. A citizen can be in various states: e.g. not involved, entered, being judged, being instructed, away for 2nd photo, back, being helped, finished. Servant's states: idle, judging, instructing, processing. Passport actions? Ferry objects and actions?
Performance indicators Passport case: average lead time, standard deviation. maximum queue size (facilities). occupation rate of civil servant. Ferry case? Average lead time and standard deviation for A to B and for B to A cars.
Problems and solutions Passport case: Long queues (possibly, depending on demand) Solutions: approve more, skip judgement, appointment system Ferry case? Which new ferry to buy Consider future developments extrapolate trends beware special circumstances!
Analysis Parameters: - maximal capacity of key resource(s) - r : arrival intensity divided by capacity (both measured in nr of cases per time unit) Capacity and intensity can be estimated or assumed. Analyze extreme cases: - small r - r almost 1
Passport problem case: citizen needing document resource: civil servant performance measured by system time (wait time + service time). Problem: long queues. Proposed solutions: - less strict judgement - oblige photo from preferred shop
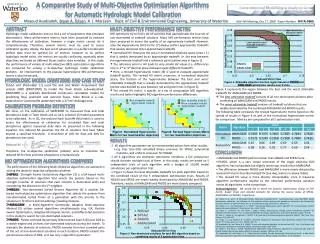
Passport analysis Analyze extreme cases. Passport/photo example: acceptratio a, with 0 < a < 1 average time to instruct photo remake: t average time to create document: u Average resource time needed for client: u+a.t (= waiting time in absence of queues) Average influx r clients per u + a.ttime units. r ≥1: not enough resource capacity; infinite waiting time. Assuming M/M/1 queue (appendix F), we obtain an average service time of (u + a.t)/ (1-r).
M/M/1 passport queue time / (u + a.t )
Passport case Simulation needed? Can you think of additional constraints that preclude the problem's analysis? Proposed solutions: - less strict judgement - oblige photo from preferred shop - introduce an appointment system Give comment on proposals Beware of tunnel vision!
Ferry problem case: car needing to cross resource: ferry performance measured by system time (wait time + service time). Problem: new ferry needed Proposed alternatives: - faster, less cars - slower, more cars
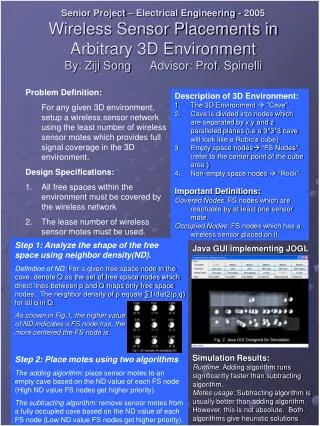
Ferry analysis Ferry example: cycle time: c; up to n≥10 places per cycle (batch size) capacity: n/c cars per time unit Input: r (n/c) cars per time unit; r <1. Minimum average waiting time c/2. Processing: fixed timec/2. Low influx (e.g. r≤ 0.3): negligible probability of more than n waiting cars. average system timec + e.
Ferry queue time / c r
Two ferries are proposed. For ferry 1, cycle time c equals 6 minutes, n equals 10. For ferry 2, cequals 8 minutes and n equals 15. systime ferry 2 systime ferry 1 system time (minutes) intensity (cars per minute)
Standard deviation important for traffic studies. measured times: 5,11,13, 7,14; average: 10 measured times: 8,11,10, 9,12; average: 10 How do the two ferries compare w.r.t. stdev?
Ferry case Simulation needed? M/D/1 queue with batches extra time for getting on/off Give essential characteristics. Choice between alternatives depends on traffic intensity. Increase expected? Decision based on mean throughput time m and standard deviation s. For only plm. 15% of cases, throughput time exceeds m+s.
Classwork/Homework Classwork: Exercises on page 6 and 10 of lecture notes. Analyze DCT case, pose additional questions, propose strategies. Homework: Study chapter 3 and appendix F of lecture notes. Special attention to Little's formula and M/M/1. Assignment (individual, discussions encouraged): Write DCT report (2 pags A4), defining concepts pertaining to the case. Indicate a few promising solution strategies. (give evidence by analysis) Mail to m.voorhoeve@tue.nl