Download

1 / 18
180 likes | 215 Vues
Learn how to create a comprehensive entity-relationship model for a university faculty database, understanding weak entities, generalized hierarchy, strengths, weaknesses, and conceptual methodology guidelines. Explore the relationships between faculty, students, and courses.

E N D
Entity-Relationship Modeling II “We don’t live in a world of reality, we live in a world of perceptions.” J. Gerald Simmons
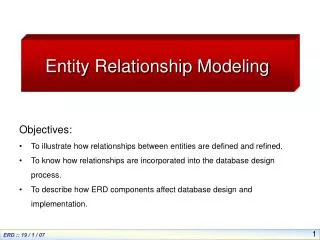
Class Outline • Using the ER methodology and notation discussed last day, create a completed entity-relationship model for: • a simple university faculty database • What are weak entities? • What is a generalized hierarchy? • What are the strengths and weaknesses of the Entity-Relationship model? • What are some guidelines for determining conceptual methodology?
FACULTY FACULTY STUDENT COURSE COURSE COURSE STUDENT teaches takes E-R Modeling: University Example • A database is to be set up to record information about faculty, the courses they teach, and the students who take courses. Some courses are taught by teams of faculty members. • Step 1. Identify entity types • Step 2. Identify relationships
F1 C1 F2 C2 F3 C3 F4 C4 F5 C5 F6 C6 S1 C1 S2 C2 S3 C3 S4 C4 S5 C5 S6 C6 University Example (cont’d) • Step 3. Determine relationship type. Ask: • Each faculty member teaches how many courses? • Each course is taught by how many faculty? • Each student takes how many courses? • Each course is taken by how many students? • Use occurrences diagram to visualize relationship between entities
This is a many-to-many relationship. M N teaches FACULTY COURSE • This, too, is a many-to-many relationship. M N takes STUDENT COURSE University Example (cont’d) • Step 3. Determine Relationship type (cont’d) • For FACULTY-teaches-COURSE we are told each faculty member teaches zero, one, or two courses. We are told some courses are taught by zero, one, two, or three faculty. • For STUDENT-takes-COURSE each student enrolls in one to six courses and each course is taken by zero or up to 30 students.
M M N N teaches FACULTY FACULTY COURSE COURSE • STUDENT-takes-COURSE - level of participation is mandatory since students must take at least one course; a course, however, may or may not have students taking it M N takes STUDENT COURSE (1,6) (0,30) University Example (cont’d) • Step 4. Determine level of participation • FACULTY-teaches-COURSE - level of participation is optional, since sometimes Faculty do not have to teach (e.g., sabbatical); similarly, a course may not have anyone interested in teaching it (0,2) (0,3)
N M CourseID, ... taken by COURSE STUDENT (0,30) (1,6) M (0,3) StudentID, ... taught by (0,2) N FACULTY FacultyID, ... University Example (cont’d) • Step 5. Assign an identifier for each entity • FacultyID, CourseID, StudentID • Step 6. Draw completed E-R diagram
1 M advises FACULTY STUDENT (0,N) (1,1) University Example (cont’d) • You are now told that in addition to the relationships given, each student is assigned a faculty advisor who gives direction in choosing courses. • Use occurrences diagram to visualize relationship between entities • We are told each student is advised by exactly one faculty advisor. We can assume that each faculty member advises zero, one, or more students. This means the additional relationship is of type one-to-many or 1:M. • The STUDENT is on the many side of the relationship and must be advised, therefore, faculty is mandatory to student; FACULTY on the one side of the relationship may or may not have a student, therefore, student is optional to faculty.
University Example (cont’d) • Step 6. Draw completed E-R diagram StudentID, CourseID ... StudentID, ... 1 M M 1 takes COURSE CourseID, ... STUDENT (0,30) 1 (0,3) M (1,6) (1,1) (1,1) (1,1) M (1,1) CourseID, FacultyID... taught by advises M (1,1) 1 (0,2) (0,N) FACULTY 1 FacultyID, ...
COURSE SECTION DEPENDENT EMPLOYEE Weak Entities • an entity that has a dependency on the existence of another entity (mandatory participation) and • has a primary key that is partially or totally derived from the parent entity of the relationship • depict weak entity with a double outline ` contains CourseID, ... CourseID, SectionID, ... ` has a EmployeeID, ... EmployeeID, DependentID, ...
Generalization Hierarchy • A subtype entity is an entity that contains a set of optional attributes of the supertype entity and inherits its attributes and its relationships from the supertype entity • If the supertype entity is related to exclusive (can belong to only one subtype) subtype entities, indicate with G; if subtypes are overlapping (can belong to more than one), use Gs supertype CONTRACT CLIENT subtype G Gs INDIVIDUAL CORPORATE PRODUCTS SERVICES The same identifier (e.g., ClientID) is used for the supertype as well as subtype.
Evaluation of the E-R Model • Using data models to conceptualize the design of a database saves time and money because a completed E-R diagram is the actual blueprint of the database. Its composition must reflect an organization's operations accurately if the database is to meet that organization's data requirements. • The completed E-R diagram also lets the designer communicate more precisely with those who commissioned the database design. It’s easier to correct design flaws at the data modeling stage. • Do not confuse entities and relationships with actual tables. The transformation or decomposition of E-R models will be discussed within the next few weeks. • E-R modeling is an iterative process. Even when complete, ER models generally do not provide a complete picture (e.g., business rules cannot always be shown), therefore, much additional documentation is necessary.
Conceptual Design Methodology 1. Define the problem and define database objectives 2. Analyze current database, assess user requirements, and create data model 3. Design data structures (tables, fields, field specifications, establish keys) 4. Establish table relationships 5. Clarify business rules critical to database design (e.g., required fields, validation rules) 6. Determine and establish user views of data 7. Review data integrity and reiterate design methodology
Statement of Purpose 1. Declare a specific purpose for the database to focus and guide its development e.g., “The purpose of the All-Star Talent database is to maintain the data we use in support of the entertainment services we provide to our clientele.” 2. Articulate goals & objectives that define specific tasks “We need to maintain complete entertainer information.” “We need to maintain complete customer information.” “We need to track all customer-entertainer bookings.” “We need to maintain financial records of both payments from customers and payments to entertainers.”
interview transcripts meeting minutes observational notes business mission and strategy statements questionnaire results document analyses business forms reports flow charts presentations computer-generated output(spreadsheets, graphs, etc.) training manuals consultant reports job descriptions Assessment of User Requirements:What is analyzed?
Assessment of User Requirements:Specific requirements Goals of analysis of user requirements: collect a list of business goals, entities to track, a database schema, and sample report outputs. • What are subjects/objects for the business? • What characteristics describe each object? • What unique characteristic distinguishes each object from other objects of the same type? • How do you use this data (e.g, summary reports)? • Over what period of time are you interested in this data? • Are all instances of each object the same? • What events occur that imply associations between various objects? • Is each activity or event always handled the same way or are there special circumstances?
Rules for Conducting User Interviews • Create a quiet, stress-free environment; set a limit of six people • Have an agenda - provide it to participants ahead of time • Focus on the problem at hand; maintain control of the interview • Conduct separate interviews for users and management • Identify the decision maker • Avoid technical jargon • Show concern for user needs • Give everyone equal and undivided attention • Write down everything where it can be seen by participants • Encourage ‘blue sky’ thinking • Arbitrate disputes • Keep the pace of the interview moving • Don’t foreclose your options too soon
Characteristics of a Database designer • Knowledge of the problem you are trying to solve • Communication skills - extensive discussions with users • Analytical aptitude - keep in mind the broad goals even while poring over the smallest details • Impertinence - question everything! • Impartiality - find best solution • Relax constraints - assume anything is possible • Pay attention to details and definitions • Reframing - iteratively analyze in new way - be creative! A good designer combines the art of design with the science of design.