Stackelberg and Bertrand
140 likes | 842 Vues
Stackelberg and Bertrand. Kevin Hinde. The Dominant Firm - Quantity Leadership. Heinrich von Stackelberg (1934) Stackelberg’s duopoly model assumed that one firm acts as a dominant firm in setting quantities.

Stackelberg and Bertrand
E N D
Presentation Transcript
Stackelberg and Bertrand Kevin Hinde
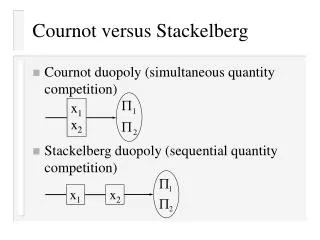
The Dominant Firm - Quantity Leadership Heinrich von Stackelberg (1934) • Stackelberg’s duopoly model assumed that one firm acts as a dominant firm in setting quantities. • Dominance implies knowledge of the way competitors will react to any given output set by the leading firm (in the Cournot model neither firm had the opportunity to react). • A dominant firm can then select that output which yields the maximum profit for itself.
numerical example revisited • Assume market demand to be • P = 30 - Q • where Q= Q1 + Q2 • ie industry output constitutes firm 1 and firm 2’s output respectively • Further, assume Q1 = Q2 • and average (AC) and marginal cost (MC) • AC = MC = 12
Assume Firm 1 is the dominant firm and has has prior knowledge of Firm 2s reaction curve. • Total Revenue for Firm 1 is as under Cournot • R1 = 30Q1 - Q12 - Q1Q2 • But Firm 1 knows Firm 1s reaction curve so • R1 = 30.Q1 - Q12 - Q1 .( 9 - 1 Q1) • 2 • R1 = 21.Q1 -1 Q12 • 2 • Thus, • MR1 = 21 - Q1
which when equated with MC (=12) to find Firm 1s equilibrium output gives • 12 = 21 - Q1 • Q1 = 9 • Q2 = 9 -1 Q1 = 4.5 2 • P = 30 - Q • P =16.5
Thus, we can see that in a duopoly framework Stackelberg assumptions offer better welfare outcomes than Cournot. Questions • Can you position the Stackelberg equilibrium on a reaction curve diagram and contrast with Cournot? • What levels of abnormal profit do you associate with each equilibrium position? • What would happen to the Cournot and Stackelberg equilibria if the marginal cost of Firm 1 was 10 whilst Firm 2’s MC remained unchanged?
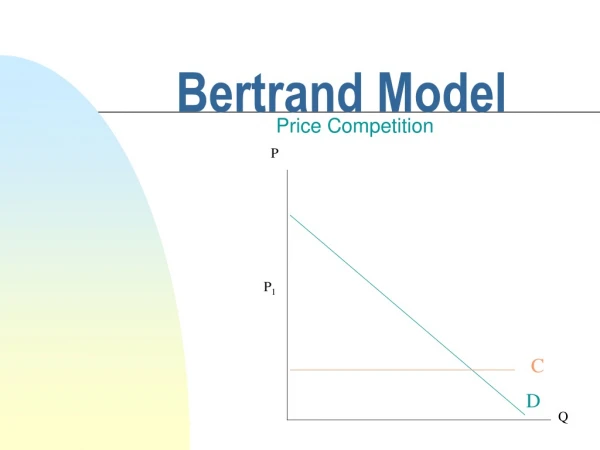
Joseph Bertrand (1883) • Bertrand argued that a major problem with the Cournot model is that it failed to make price explicit. • He showed that if firms compete on price when goods are homogenous, at least in consumer’s eyes, then a price war will develop such that price approaches marginal cost. • However, the introduction of differentiation leads to equilibrium closer in spirit to Cournot.
P1 P2= f(P1) Collusive Equilibrium Pm P1= f(P2) Ppc Pm P2 Ppc Product Differentiation