
Chapter 10 - Layout
E N D
Presentation Transcript
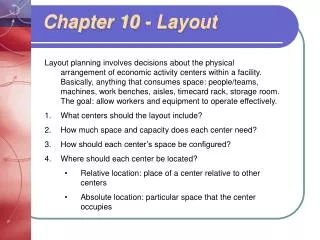
Chapter 10 - Layout • Layout planning involves decisions about the physical arrangement of economic activity centers within a facility. Basically, anything that consumes space: people/teams, machines, work benches, aisles, timecard rack, storage room. The goal: allow workers and equipment to operate effectively. • What centers should the layout include? • How much space and capacity does each center need? • How should each center’s space be configured? • Where should each center be located? • Relative location: place of a center relative to other centers • Absolute location: particular space that the center occupies
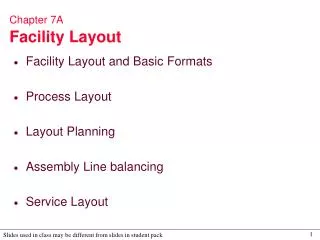
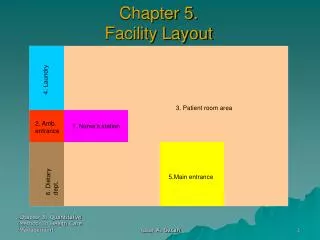
Grinding Forging Lathes Station 1 Station 2 Station 3 Station 4 Painting Welding Drills Milling Office Foundry machines Layout Types • Layout can: • facilitate flow of materials and information. • Increase utilization of labor and equipment • Reduce hazards to workers • Improve employee morale • Improve communication • Process layout: groups workstations according to function: most common when the same operation must intermittently produce many different products or serve many customers. • Product layout: centers are arranged in a linear path; continuousflow; high volume; L, O, S U - shapes • Advantages/disadvantages on page 448! (a) Layout of a job shop (b) Layout of a production line
Layout Types • Flexible Manufacturing Systems (FMS) were born out of the desire to make small batch production more efficient and recently to improve the company’s market performance by improving manufacturing flexibility (Chen et al, 1992). There are three key components to FMS: • Several CNC machines (only one CNC would be a FM Cell not FMS) and the hierarchy of the communication and levels of control (Stecke) • An automated material handling system for moving materials and parts from one machine to another (conveyor, guided carts, AGV) • A host computer controlling the CNC’s • FMS are designed around families of parts for mid-volume production. FMS completes a given number of operations on an item before it leaves the system. The root process is still batch. Manufacturers should consider several important implications before implementing FMS: • Technological – CNC machines, CAD, Robots, AGV (auto guided vehicles). Early in FMS development, FMS technology was purchased to reduce environmental uncertainty (threats). Research by Chen et al (1992) proposed that FMT can assume an offensive role to turn threats into opportunities and firms can achieve benefits of manufacturing flexibility. • Financial – capital appraisal techniques • Political – management, skills, commitment • Sociological – fewer jobs
Machine 2 Machine 3 Machine 1 Materials in Finished goods out Machine 4 Machine 5 Hybrid Layouts • One-worker, multiple-machines cell: worker operates several different machines simultaneously to achieve a line flow. • Can change setupsto produce differentproduct/part • Reduces inventory
Group Technology • Product layouts with low-volume processes. Creates cells not limited to just one worker and groups parts or products with similar characteristics into families and sets aside groups of machines for production. • Goal is to minimize setup or changeovers for similar processing requirements
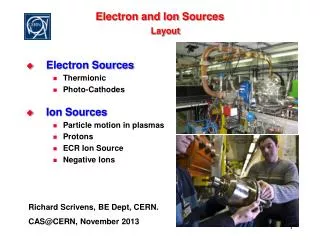
Lathing Milling Drilling D D L L M M M L L G Assembly area D D D L L M M A A Cell 1 Cell 2 Grinding L M Receiving G G L L M M G G Cell 3 Assembly L L G G M L D A A Shipping Receiving and shipping A A G G Group Technology (b) Line flows in a job shop with three GT cells • Jumbled flows in a job shop without GT cells First image is grouped to function (lathing, milling, drilling) After lathing, part is moved to next function where it waits until it has a higher priority than any other job competing for the machine. Second image is grouped into product families – simplified the flow.
Designing Process Layouts • Line Balancing – assignment of work stations in a line to achieve desired output rate with the smallest number of workstations. Line is as only as fast as the slowest workstation. • Work elements –smallest unit of work that can be performed independently and immediate predecessors – work elements that must be done before the next can begin. • Precedence diagram – work elements are circles and time required to perform work is below the circle. Arrows lead from immediate predecessors to next work element.
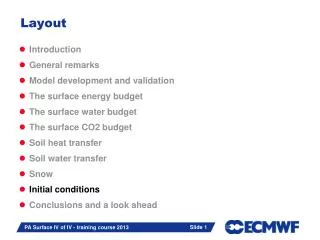
Work Time Immediate Element Description (sec) Predecessor(s) A Bolt leg frame to hopper 40 None B Insert impeller shaft 30 A C Attach axle 50 A D Attach agitator 40 B E Attach drive wheel 6 B F Attach free wheel 25 C G Mount lower post 15 C H Attach controls 20 D, E I Mount nameplate 18 F, G Total 244 D H 40 B 20 30 E 6 A F 40 C 25 50 I 18 G 15 Line Balancing
D H 40 B 20 30 E 6 A F 40 C 25 50 I 18 G 15 Line Balancing Desired output rate = 2400/week Plant operates 40 hours/week r = 2400/40 = 60 units/hour c = 1/60 = 1 minute/unit = 60 seconds/unit Matching output to demand decreases inventory. After determining desired output rate for a line, calculate the line’s cycle time. This is the maximum time allowed for work on a unit at each station. If the time for work elements at a station exceeds the line’s cycle time, causes bottlenecks. Cycle time = 1/r where r is the desired output rate.
D H 40 B 20 30 E 6 A F Desired output rate = 2400/week Plant operates 40 hours/week 40 C 25 50 TM = 244 seconds/60 seconds = 4.067 or 5 stations always round up Efficiency = [244\5(60)]100 = 81.3% I 18 G 15 Line Balancing c = 60 seconds/unit TM = 5 stations Efficiency = 81.3% Theoretical minimum: to achieve the desired output rate, use line balancing to work to a station, satisfying precedence relations and minimizing the number of workstations. Minimizing n, the number of workstations also maximizes worker productivity.
Line Balancing Theoretical minimum = St / c Where St = total time required to assemble each unit (the sum of all work element standard times) c = cycle time Idle time, efficiency, and balance delay: Minimizing n automatically ensures minimal idle time, maximum efficiency, and minimal balance delay. Idle time is the total unproductive time for all stations in the assembly of each unit: Idle time = nc – St Efficiency – ratio of productive time to total time, as a percent: St / nc (100) Balance delay – amount by which efficiency falls short of 100%: 100-Efficiency
Finding a solution • Longest work-element time: assigns, as quickly as possible, those work elements most difficult to fit into a station and saves work elements having shorter times for fine tuning • Largest number of followers – reduces unnecessary station idle time
D H 40 B 20 30 E S1 S3 6 A S2 F 40 C 25 50 I 18 G 15 Line Balancing c = 60 seconds/unit TM = 5 stations Efficiency = 81.3%
Cumm Idle Station Candidate Choice Time Time S1 A A 40 20 S2 B,C C 50 10 S3 B,F,G B 30 30 E,F,G F 55 5 Finding a Solution S4 D,E,G D 40 20 E,G G 55 5 S5 E,I I 18 42 E E 24 36 H H 44 16
D H 40 B 20 30 E 6 A F 40 C 25 50 I 18 G 15 Line Balancing c = 60 seconds/unit TM = 5 stations Efficiency = 81.3% S1 S3 S4 S2 S5