Empirical Correlations
Empirical Correlations.

Empirical Correlations
E N D
Presentation Transcript
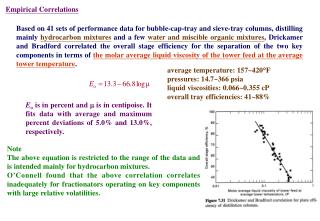
Empirical Correlations Based on 41 sets of performance data for bubble-cap-tray and sieve-tray columns, distilling mainly hydrocarbon mixtures and a few water and miscible organic mixtures, Drickamer and Bradford correlated the overall stage efficiency for the separation of the two key components in terms of the molar average liquid viscosity of the tower feed at the average tower temperature. average temperature: 157~420F pressures: 14.7~366 psia liquid viscosities: 0.066~0.355 cP overall tray efficiencies: 41~88% Eo is in percent and is in centipoise. It fits data with average and maximum percent deviations of 5.0% and 13.0%, respectively. Note The above equation is restricted to the range of the data and is intended mainly for hydrocarbon mixtures. O’Connell found that the above correlation correlates inadequately for fractionators operating on key components with large relative volatilities.
As shown in Figure 7.32, Lockhart and Leggett were able to obtain a single correlation by using the product of liquid viscosity and an appropriate volatility as the correlating variable. For fractionators, the relative volatility of the key components was used; for hydrocarbon absorbers, the volatility was taken as 10 times the K-value of a selected key component, which must be one that is reasonably distributed between top and bottom products. applying to all three trays For the distillation data plotted in Figure 7.32, which a viscosity-relative volatility range for distillation of from 0.1 to 10 cP, the O’Connell correlation fits the empirical equation Eo is in percent and is in centipoise, The relative volatility is determined for the two key components at average column conditions.
Most of the data for developing the correlation of Figure 7.32 are for columns having a liquid flow path across the active tray area of from 2 to 3 ft. Gautreaux and O’Connell, using theory and experimental data, showed that higher efficiencies are achieved for longer flow paths. For short liquid flow paths, the liquid flowing across the tray is usually mixed completely. For longer flow paths, the equivalent of two or more completely mixed, successive liquid zones may be present. The result is a greater average driving force for mass transfer, and, thus, a higher efficiency-sometimes even greater than 100%. Provided that the viscosity-volatility product lies between 0.1 and 1.0, Lockhart and Leggett recommend addition of the increments in Table 7.5 to the value of Eo from Figure 7.32 when the liquid flow path is greater than 3 ft. However, at large liquid rates, long liquid path lengths are undesirable because they lead to excessive liquid gradients, causing maldistribution of vapor flow.
Example 7.7 For the benzene-toluene distillation of Figure 7.1, use the Drickamer-Bradford and O’Connell correlations to estimate the overall stage efficiency and number of actual plates required. Calculate the height of the tower assuming 24-in. tray spacing, with 4 ft above the top tray for removal of entrained liquid and 10 ft below the bottom tray for bottoms surge capacity. The separation requires 20 equilibrium stages plus a partial reboiler that acts as an equilibrium stage. Solution For estimating overall stage efficiency, the liquid viscosity is determined at the feed-stage condition of 220 F, assuming a liquid composition of 50 mol% benzene. of benzene = 0.10 cP; of toluene = 0.12 cP; average = 0.11 cP; average volatility = (top+bottom)/2=(2.52+2.26)/2=2.39 20/0.77=26 plates Drickamer-Bradford correlation column height=4+2(26-1)+10 = 64 ft O’Connell correlation 20/0.68=30 plates column height=4+2(30-1)+10 = 72 ft
Semitheoretical Models ~In Section 6.5, semitheoretical tray models based on the Murphree vapor efficiency and the Murphree vapor-point efficiency are applied to absorption and stripping. These same relationships are valid for distillation. ~However, because the equilibrium line is curve for distillation, must be taken as mV/L (not KV/L=1/A), where m=local slope of the equilibrium curve = dy/dx. ~In Section 6.6, the method of Chan and Fair is used for estimating the Murphree vapor- point efficiency from mass transfer considerations. The Murphree vapor efficiency can then be estimated. The Chan and Fair correlation is specifically applicable to binary distillation because it was developed from experimental data that includes six different binary systems.
Scale-up from Laboratory Data Where nonideal solutions are formed and/or the possibility of azeotrope formation exists, use of a small laboratory Oldershaw column, of the type discussed in Section 6.5, should be used to verify the desired degree of separation and to obtain an estimate of the Murphree vapor point efficiency. ~The Oldershaw columns is 1-in. glass and 2-in.metal diameter. ~The Oldershaw columnsis assumed to measure point efficiency. ~Data from the Oldershaw column are in reasonable agreement with the FRI data for 14% open area, except at the lower part of the flooding range. ~In Figure 7.33b and 7.33c, the FRI data for 8% open area show efficiency as much as 10 percentage points higher.
Capacity of Trayed Towers and Reflux Drums Trayed Towers ~In Section 6.6, methods for estimating tray capacity and pressure drop for absorbers and strippers are presented. These same methods apply to distillation columns. ~Calculations of column diameter are usually made for conditions at the top and bottom trays of the tower. If the diameters differ by 1 ft or less, the larger diameter is used for the entire column. If the diameter differ by more than 1 ft, it is often more economical to swage the column, using the different diameter for the sections above and below the feed.
Reflux Drums ~The reflux drum is usually located near ground level, necessitating a pump to lift the reflux to the top of the column. ~If a partial condenser is used, the drum is often installed vertically to facilitate the separation of vapor from liquid-in effect, acting as a flash drum. ~Vertical reflux and flash drums are sized by calculating a minimum drum diameter, DT, to prevent liquid carryover by entrainment, using (6-44) in conjunction with the curve for 24- in. tray spacing in Figure 6.24 and a value of FHA=1.0 in (6.42). ~To absorb process upsets and fluctuations, and otherwise facilitate control, vessel volume, VV, is determined on the basis of liquid residence time, t, which should be at least 5 min, with the vessel half full of liquid: where L is the molar liquid flow rate leaving the vessel. Assume a vertical, cylindrical vessel and neglecting the volume associated with the heads, the height H of the vessel is However, if H>4DT, it is generally preferable to increase DT and decrease H to give H=4DT. Then
Example 7.8 Equilibrium vapor and liquid streams leaving a flash drum are as follows: Determine the dimensions of the flash drum. Solution Using Figure 6.24, CF at a 24-in. tray spacing is 0.34. Assume, in (6.42), that C=CF. From (6-40),
From (6-44) with Ad/A=0, From (7-44), with t = 5 min = 0.0833 h, From (7-43), However, H/DT = 19.3/2.26=8.54 > 4. Therefore, redimension VV for H/DT=4. From (7-44), Height above the liquid level is 11.64/2=5.82 ft, which is adequate.
Rated-Based Method for Packed Columns ~With the availability of economical and efficient packings, packed towers are finding increasing use in new distillation processes and for retrofitting existing trayed towers. ~Methods in Section 6.8 for estimating packed column efficiency, capacity, and pressure drop for absorbers are applicable to distillation. ~Methods for determining packed height are similar to those presented in Section 6.7 and are extended here for use in conjunction with the McCabe-Thiele diagram. ~Both the HETP and the HTU methods are discussed and illustrated. Unlike the case of absorption or stripping of dilute solutions, where values of HETP and HTU may be constant throughout the packed height, values of HETP and HTU can vary over the packed height of a distillation column, especially across the feed entry, where appreciable changes in vapor and liquid traffic occur. ~Also, because equilibrium line for distillation is curved rather than straight, the mass transfer equations of Section 6.8 must be modified by replacing =KV/L=1/A with where m=dy/dx varies with location in the tower.
HETP Method ~In the HETP method, the equilibrium stages are first stepped off on a McCabe-Thiele diagram. The case of equimolar counterdiffusion (EMD) applies to distillation. ~At each stage, the temperature, pressure, phase flow ratio, and phase compositions are noted. ~A suitable packing material is selected and the column diameter is estimated for operation at 70% of flooding by one of the methods of Section 6.8. ~Mass transfer coefficients for the individual phases are estimated for the conditions at each stage from correlations also discussed in Section 6.8. ~From these coefficients, values of HOG and HETP are estimated for each stage. The latter values are then summed to obtain the separate packed heights of the rectifying and stripping sections. ~If experimental values of HETP are available, they are used directly. ~In computing values of HOG from HG and HL, or Ky from ky and kx, (6-92) and (6-80) must be modified because for binary distillation where the mole fraction of the light key may range from almost 0 at the bottom of the column to almost 1 at the top of the column, the ratio (y1-y*)/(x1-x) in (6-76) is no longer a constant equal to the K-value, but is dy/dx equal to the slope, m, of the equilibrium curve.
Example 7.9 For the benzene-toluene distillation of Example 7.1, determine packed heights of the rectifying and stripping sections based on a column diameter and packing material with the following values for the individual HTUs. Included are the L/V values for each section from Example 7.1. Solution Slopes of dy/dx of the equilibrium curve are obtained from Figure 7.15 and values of from (7-47). HOG for each stage is determined from (7-52) in Table 7.6. HETP for each stage is determined from (7-53) in Table 7.6. The results are given in Table 7.7, where only 0.2 of stage 13 is needed and stage 14 is the partial reboiler. Base on the results in Table 7.7, 10 ft of packing should be used in each of the two sections.
HTU Method In HTU method, equilibrium stages are not stepped off on a McCabe-Thiele diagram. Instead, the diagram provides data to perform an integration over the packed height of each section using either mass transfer coefficient or transfer units. Consider the diagram of a packed distillation column and its accompanying McCabe-Thiele diagram in Figure 7.34. Assume that V, L, and are constant in their respective sections. For equimolar concentration diffusion (EMD), the rate of mass transfer of the light-key component from the liquid phase to the vapor phase is
mass balance over an incremental section of packed height, assuming constant molar overflow, S is the cross sectional area of the packed section. integrating over the rectifying section, integrating over the stripping section, Note: If the kxa>kya, the main resistance to mass transfer resides in the vapor and it is most accurate to evaluate the integrals in y.
Example 7.10 Suppose that 250 kmol/h of a mixture of 40 mol% isopropyl ether in isopropanol is distilled in a packed column operating at 1 atm to obtain a distillate of 75 mol% isopropyl ether and a bottom of 95 mol% isopropanol. At the feed entry, the mixture is a saturated liquid. A reflux ratio of 1.5 times minimum is used and the column is equipped with a total condenser and a partial reboiler. For the packing and column diameter, mass transfer coefficients given below have been estimated from empirical correlations of the type discussed in Section 6.8. Compute the required packed heights of the rectifying and stripping sections. Solution D=125 kmol/h B=250-125 kmol/h (L/V)min=0.39 L/V=120/245=0.49