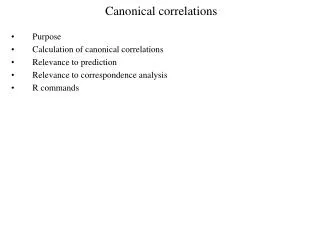
Correlations
This text explores the correlation coefficient, a numerical index that depicts the relationship between two variables. Ranging from -1 to +1, it identifies both positive and negative correlations—the former indicates that variables move in the same direction, while the latter shows they move in opposite directions. Positive correlations score from 0 to +1, and negative correlations from 0 to -1. The use of scatterplots effectively visualizes these correlations, enabling better understanding of the relationships between multiple variables in a correlation matrix.


Correlations
E N D
Presentation Transcript
Correlations Relationships between variables
Correlation Coefficient • Numerical index that reflects the relationship between 2 variables • Ranges from –1 to +1 • Pearson product-moment correlation or Pearson’s r
Types of correlations • Positive or direct correlation • 2 variables move in the same direction • Scores range: • 0 (no correlation) to +1.0 (perfect correlation) • Negative or indirect correlation • 2 variables more in the opposite direction • Scores range: • 0 (no correlation) to –1.0 (perfect correlation)
Scatterplot • Illustrates the relationship between variables • X on the horizontal axis • Y on the vertical axis • Positive correlation • Data from lower left to upper right • Negative correlation • Data from upper right to lower left
Multiple correlationsAKA correlation matrix • Shows correlations between multiple variables • Series of bivariate correlations