Understanding Correlation and Linear Regression: Key Concepts and SPSS Implementation
This document outlines essential concepts of correlation and linear regression as covered in Chapter 8 of Pollock. Students will learn to interpret empirical data, calculate Pearson’s correlation coefficient (r), and understand the distinction between correlation and causation. The use of scatterplots for visualizing relationships and how to conduct statistical analysis using SPSS software is also emphasized, including creating scatterplots and interpreting the results. Students are encouraged to participate in office hours for further assistance with course materials.


Understanding Correlation and Linear Regression: Key Concepts and SPSS Implementation
E N D
Presentation Transcript
Correlations 11/7/2013
Readings • Chapter 8 Correlation and Linear Regression (Pollock) (pp. 182-187) • Chapter 8 Correlation and Regression (Pollock Workbook)
Homework Due Today • Chapter 7 Pollock Workbook • Question 1 • A, B, C, D, E, F • Question 2 • A, B, C, D • Question 3 (use the dataset from the homework page) • A, B, C, D • Question 5 • A, B, C D, E
Office Hours For the Week • When • Friday 10-12 • Monday 10-12 • Tuesday 8-12 • And by appointment
Course Learning Objectives • Students will be able to interpret and explain empirical data. • Students will achieve competency in conducting statistical data analysis using the SPSS software program.
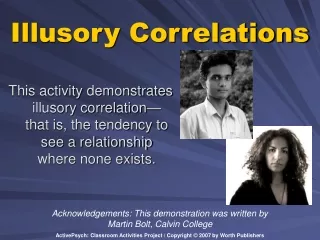
What is correlation? • Any relationship between two variables • Correlation does not mean causation
What Could Be Happening? • Variable A influences variable B • Variable B influences variable A • It is a coincidence • Some other variable (C) influences both A and B
Measuring Pearson’s r • Measure from -1 to 0 to 1. • -1 means a perfect negative relationship • 0 is the absence of any relationship • +1 is a perfect positive relationship • Like Somers’ D, Pearson's "r" scores tell us • Direction • Strength of Association • Statistical significance of the measure
PEARSON'S r's are PRE Measures! • Squaring the (r) value provides a measure of how much better we can do in predicting the value of the d.vby knowing the independent variable. • We call this a r2(r-square) value.
More on Scatterplots • We can think of this line as a prediction line. • The closer the dots to the line, the stronger the relationship, the further the dots the weaker the line. • If all the data points are right on the regression line, then there is a perfect linear relationship between the two variables. • This only graphs a correlation...... this means that it does not mean causality nor should it be used for testing!
How to do it • Graphs • Legacy Dialogs • Scatter/Dot...
A Window pops up Select simple Choose Define
Adding Case Labels • put your variable in the Label Cases by area • Click on Options, and this will open up a window • Click on display chart with case labels and continue • Click OK
Do not use scatterplots for testing! There are better measures, especially if you have more than 1 iv. (your paper should not include any scatterplots)
Lets try an example • Use the following data set • D.V. Obama • I.V. Unemp • Follow the directions from last class
What is Going on? • The Line of Best Fit- • How much error is in our line. • A predictor for future values • Eyeballing the data, a state with 4% unemployment should give Obama how much support?
Primary data • Collection • Advantages • Disadvantages
Secondary Data • Collection • Advantages • Disadvantages