Download
1 / 41
410 likes | 567 Vues
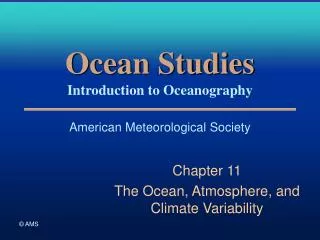
Ocean Studies Introduction to Oceanography American Meteorological Society. Chapter 11 The Ocean, Atmosphere, and Climate Variability. Case in Point. In 1982-83, the weather seemed to go wild in many parts of the world.

E N D
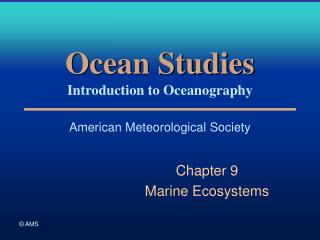
Ocean StudiesIntroduction to OceanographyAmerican Meteorological Society Chapter 11 The Ocean, Atmosphere, and Climate Variability
Case in Point • In 1982-83, the weather seemed to go wild in many parts of the world. • Just prior to these worldwide weather extremes, the ocean circulation off the northwest coast of South America changed drastically with dire implications for marine production. • Weather extremes were linked to large-scale ocean/atmosphere circulation changes in the tropical Pacific and soon a new scientific term was added to the public’s vocabulary: El Niño. • Spurred further research on ocean-atmosphere interactions and the deployment of an array of in situ and remote sensing instruments in the tropical Pacific to provide early warning of the development of El Niño
The Ocean, Atmosphere, and Climate Variability • Driving Question: • How do interactions between the ocean and atmosphere impact worldwide weather and short-term climate variability?
The Ocean, Atmosphere, and Climate Variability • In this chapter, we examine: • Short-term climate fluctuations involving interactions between the ocean and atmosphere • El Niño/La Niña • Other examples of short-term climate variability stemming from air/sea interactions including the North Atlantic Oscillation, the Arctic Oscillation, and the Pacific Decadal Oscillation
Earth’s Climate System • CLIMATE CONTROLS • Latitude, elevation, topography, proximity to large bodies of water, Earth’s surface characteristics, net incoming solar radiation, long-term average atmospheric circulation, prevailing ocean circulation • Atmospheric circulation encompasses the combined influence of all weather systems operating at all spatial and temporal scales ranging from sea breezes to the prevailing winds that encircle the planet. • Although strongly influenced by the other climate controls, atmospheric circulation is considerably less regular and less predictable than the others.
Earth’s Climate System • ROLE OF THE OCEAN • The ocean influences radiational heating and cooling of the planet. • A primary control of how much solar radiation is absorbed at the Earth’s surface • Main source of the most important greenhouse gas (water vapor) and is a major regulator of the concentration of atmospheric carbon dioxide (CO2) • At high latitudes highly reflective multi-year pack ice greatly reduces the amount of solar radiation absorbed by the ocean.
Earth’s Climate System • ROLE OF THE OCEAN • Most water vapor, the principal greenhouse gas, enters the atmosphere via evaporation of seawater. • Carbon dioxide, a lesser greenhouse gas, cycles into and out of the ocean depending on the sea surface temperature, circulation patterns, and biological activity in surface waters. • The ocean influences the planetary energy budget not only by affecting the radiational heating and radiational cooling of the entire planet, but also by contributing to the non-radiative latent heat and sensible heat fluxes at the air-sea interface.
ROLE OF THE OCEAN Ocean currents strongly influence climate. Cold surface currents, such as the California Current, are heat sinks; they chill and stabilize the overlying air, thereby increasing the frequency of sea fogs and reducing the likelihood of thunderstorms. Relatively warm surface currents, such as the Gulf Stream, are heat sources; they supply heat and moisture to the overlying air, destabilizing the air, thereby energizing storm systems. Earth’s Climate System
Earth’s Climate System • ROLE OF THE OCEAN • Broad scale patterns of sea-surface temperature (SST) strongly influence the location of major features of the atmosphere’s planetary scale circulation. • When SST patterns change so too do the locations of planetary-scale circulation features. • North-south shifts of the intertropical convergence zone (ITCZ)
Tropical Pacific Ocean/Atmosphere • HISTORICAL PERSPECTIVE • Originally, El Niño was the name given by fishermen to a period of an unusually warm southward flowing ocean current and poor fishing off the coast of Peru and Ecuador that often coincided with the Christmas season. • These warm water episodes are relatively brief, lasting perhaps a month or two, before sea surface temperatures and the fisheries return to normal. • About every three to seven years, however, El Niño persists for 12 to 18 months or even longer and is accompanied by significant changes in SST over vast stretches of the tropical Pacific, major shifts in planetary-scale oceanic and atmospheric circulations, and collapse of important South American fisheries.
Tropical Pacific Ocean/Atmosphere • HISTORICAL PERSPECTIVE • Southern oscillation: a seesaw variation in air pressure across the tropical Indian and Pacific Oceans • When air pressure was low over the Indian Ocean and the western tropical Pacific, it was high east of the international dateline in the eastern tropical Pacific. • The Southern oscillation index (SOI) is based on the difference in air pressure between Darwin and Tahiti.
Tropical Pacific Ocean/Atmosphere Variation in the southern oscillation index based on monthly mean sea level pressure anomalies at Darwin, Australia and Tahiti. Strongly positive values of the index indicate La Niña conditions and strongly negative values of the index indicate El Niño conditions. The thick black line is the 10-year running mean (trend line)
Tropical Pacific Ocean/Atmosphere • HISTORICAL PERSPECTIVE • Relationship between El Niño and the southern oscillation • An El Niño episode begins when the air pressure gradient across the tropical Pacific starts to weaken, heralding the slackening of the trade winds. • Refer to this relationship between El Niño and the Southern Oscillation by the acronym ENSO
Tropical Pacific Ocean/Atmosphere • HISTORICAL PERSPECTIVE • What is unique about ENSO is the strong coupling: changes in the ocean drive changes in the atmosphere which then feedback and further alter the ocean. • La Niña: essentially opposite El Niño • Some scientists refer to the warm El Niño and cold La Niña as opposite extremes of the ENSO cycle.
Tropical Pacific Ocean/Atmosphere • NEUTRAL CONDITIONS IN THE TROPICAL PACIFIC • Prevailing winds blow from the south or southeast along the west coast of South America so that most of the time Ekman transport drives warm surface water to the left (westward), away from the coast. • Causes cold, nutrient-rich water to well up from below the thermocline and replace the warm, nutrient poor surface water that is transported offshore • Upwelling is also responsible for a tongue of relatively cool surface waters along the equator in the eastern tropical Pacific.
Tropical Pacific Ocean/Atmosphere • NEUTRAL CONDITIONS IN THE TROPICAL PACIFIC • Equatorial upwelling produces a strip of relatively low sea surface temperatures along the equator from the coast of South America westward to near the international dateline. • Trade winds drive a pool of relatively warm surface waters westward toward Indonesia and northern Australia. • The contrast in sea-surface temperature between the western and eastern tropical Pacific (averaging about 8 Celsius degrees or 14.4 Fahrenheit degrees) has important implications for precipitation across the tropical Pacific.
Tropical Pacific Ocean/Atmosphere Benchmark average rainfall in millimeters per day (mm/d) across the tropical Pacific Ocean for the 10-year period 1998 through 2007. The heaviest rainfall is in the western tropical Pacific where sea-surface temperatures are highest. These data were obtained from the TRMM Microwave Imager and IR sensors onboard geosynchronous satellites supplemented by conventional rain gauge measurements.
Tropical Pacific Ocean/Atmosphere • NEUTRAL CONDITIONS IN THE TROPICAL PACIFIC • The contrast between relatively high air pressure over the central and eastern tropical Pacific and relatively low air pressure over the western tropical Pacific ultimately drives the trade winds. • Winds initially blow from regions where air pressure is relatively high toward regions where air pressure is relatively low. • The greater the air pressure contrast the stronger are the winds. • High SST in the western tropical Pacific lower the surface air pressure whereas low SST in the eastern tropical Pacific raise the surface air pressure.
Tropical Pacific Ocean/Atmosphere • NEUTRAL CONDITIONS IN THE TROPICAL PACIFIC • In the western tropical Pacific warm humid air rises, expands, and cools. • Water vapor condenses into towering cumulonimbus (thunderstorm) clouds that produce heavy rainfall. • Aloft this air flows back eastward and sinks over the cooler waters of the eastern tropical Pacific. • Sinking air is compressed and warmed so that clouds vaporize or fail to develop. • This completes the large convective-type circulation known as the Walker Circulation.
Tropical Pacific Ocean/Atmosphere Schematic block diagram showing ocean/atmosphere conditions in the tropical Pacific during normal or neutral episodes. Red indicates areas of highest sea-surface temperatures
Tropical Pacific Ocean/Atmosphere • EL NIÑO, THE WARM PHASE • With the onset of El Niño, air pressure falls over the eastern tropical Pacific and rises over the western tropical Pacific as part of the southern oscillation. • Trade winds slacken in the western and central equatorial Pacific. • Trade winds west of the international dateline may reverse direction and blow toward the east. • With relaxation of the trade winds, the westward flow of the equatorial currents weakens and at times reverses direction. • The thick layer of warm surface water normally in the west drifts slowly eastward across the tropical Pacific.
Tropical Pacific Ocean/Atmosphere Schematic block diagram showing ocean/atmosphere conditions in the tropical Pacific during El Niño conditions. Red indicates areas of highest sea-surface temperatures
Tropical Pacific Ocean/Atmosphere • EL NIÑO, THE WARM PHASE • In the western tropical Pacific, SST drops, sea-level falls, and the thermocline rises. • In the eastern tropical Pacific, SST rises, sea-level climbs, and the thermocline deepens. • Arrival of warm surface waters in the eastern tropical Pacific reduces upwelling of nutrient-rich waters along the coast of Ecuador and Peru. • The commercial fish harvest plummets. • Warmer surface waters can also severely stress coral reefs living in shallow tropical waters.
Tropical Pacific Ocean/Atmosphere Sea level record at Galápagos in the eastern tropical Pacific based on tide gauge records and expressed in cm as departure from the long-term average. Relatively high sea levels correspond to El Niño episodes.
Tropical Pacific Ocean/Atmosphere • EL NIÑO, THE WARM PHASE • During El Niño, lower than usual SST in the western tropical Pacific and higher than usual SST in the central and eastern tropical Pacific coupled with the change in trade wind circulation give rise to anomalous weather patterns in the tropics and subtropics. • El Niño also influences the intensity, frequency, and spatial distribution of tropical cyclones. • Has a ripple effect on the weather and climate of middle latitudes, especially in winter • Linkage between changes in atmospheric circulation occurring in widely separated regions of the globe, often over distances of thousands of kilometers, is known as a teleconnection.
Tropical Pacific Ocean/Atmosphere • THE 1997-98 EL NIÑO • Rivaled its 1982-83 predecessor as the most intense of the 20th century • Developed rapidly with the trade winds weakening and eventually reversing direction in the western tropical Pacific in early 1997 • Equatorial upwelling ceased during the Northern Hemisphere summer of 1997. • Warming was rapid in the eastern tropical Pacific with SST setting new record highs each successive month from June through December.
Evolution of the 1997-98 El Niño as derived from changes in ocean surface height as measured by altimeter sensors onboard the TOPEX/Poseidon satellite.
Tropical Pacific Ocean/Atmosphere • LA NIÑA,THE COLD PHASE • La Niña is a period of unusually strong trade winds and exceptionally vigorous upwelling in the eastern tropical Pacific. • Tends to persist for 12 to 18 months • Surface waters are colder than usual over the central and eastern tropical Pacific and somewhat warmer than usual over the western tropical Pacific. • Accompanying La Niña are worldwide weather extremes that are often opposite those observed during El Niño.
Tropical Pacific Ocean/Atmosphere Schematic block diagram showing ocean/atmosphere conditions in the tropical Pacific during La Niña conditions. Red indicates areas of highest sea-surface temperatures
Tropical Pacific Ocean/Atmosphere • PREDICTING AND MONITORING EL NIÑO AND LA NIÑA • Forecasters rely on two basic types of numerical models to predict the onset, evolution, and decay of El Niño or La Niña: empirical (or statistical) models and dynamical models. • An empirical model compares current and evolving oceanic and atmospheric conditions with comparable observational data for periods preceding El Niño (or La Niña) episodes over the prior 40 years. • A dynamical model consists of a series of mathematical equations that simulates interactions or coupling among atmosphere, ocean, and land.
Tropical Pacific Ocean/Atmosphere • PREDICTING AND MONITORING EL NIÑO AND LA NIÑA • Reliable observational data from the tropical Pacific Ocean and atmosphere are essential for detecting a developing El Niño or La Niña, and for initializing numerical models. • Accuracy of dynamical models depends on • How well their component equations simulate the coupled ocean/atmosphere/land system • Reliable observational data
Tropical Pacific Ocean/Atmosphere • PREDICTING AND MONITORING EL NIÑO AND LA NIÑA • ENSO Observing System: consists of an array of moored and drifting instrumented buoys, island and coastal tide gauges, ship-based measurements, and satellites • TAO (Tropical Atmosphere /Ocean) array of moored buoys in the tropical Pacific Ocean • Renamed TAO/TRITON in 2000 • Presently consists of approximately 70 deep-sea moorings that measure several atmospheric variables (air temperature, wind, relative humidity) as well as oceanic parameters (sea-surface and subsurface temperatures at 10 depths in the upper 500 m or 1640 ft)
Tropical Pacific Ocean/Atmosphere Components of the ENSO Observing System provide advance warning and monitor the development and decay of El Niño and La Niña events An instrumented TAO moored buoy
PREDICTING AND MONITORING EL NIÑO AND LA NIÑA Remote sensing by satellite plays an important role in providing early warning of an evolving El Niño or La Niña. Sensors onboard NOAA and NASA satellites monitor cloud cover and map sea surface temperatures. Tropical Pacific Ocean/Atmosphere Sea level record at a location along the equator in the eastern tropical Pacific derived from measurements made by the TOPEX/Poseidon satellite. Sea level is expressed in cm as departure from the long-term average. Relatively high sea levels correspond to El Niño episodes.
Tropical Pacific Ocean/Atmosphere • FREQUENCY OF EL NIÑO AND LA NIÑA • In 2003, NOAA scientists created an Index that forms the basis for operational definitions of El Niño and La Niña. • Based on six variables measured in the tropical Pacific: sea-level air pressure, zonal (east-west) component of surface wind, meridional component of surface wind, surface air temperature, sky cloud cover, and sea-surface temperature
Tropical Pacific Ocean/Atmosphere Variations in the Multivariate ENSO Index showing the sequence of El Niño and La Niña events since 1950
North Atlantic Oscillation • The North Atlantic Oscillation (NAO) refers to a seesaw variation in air pressure between Iceland and the Azores. • Influences precipitation and temperatures primarily in winter (December to March) over eastern North America and much of Europe and North Africa • NAO Index is directly proportional to the strength of the North Atlantic air pressure gradient • Varies significantly from one year to the next and from decade to decade and is much less regular than the ENSO cycle
North Atlantic Oscillation Record of the North Atlantic Oscillation (NAO) during winter (December to March) through 2006-2007, based on the difference between the normalized sea-level air pressure at Gibraltar and the normalized sea-level air pressure over southwest Iceland. Solid black line is a running mean.
Arctic Oscillation • Seesaw variation in air pressure between the North Pole and the margins of the polar region • Shifts between negative and positive phases • During its negative phase, the air pressure gradient is weaker and the polar vortex circulation is not as strong as usual • Allows bitterly cold Arctic air masses to more frequently move out of their source regions in the far north and plunge southeastward into middle latitudes • When the Arctic Oscillation is in its positive phase, the air pressure gradient is greater and winds encircling the Arctic are stronger • Stronger winds act as a dam to impede the southeastward flow of Arctic air
Pacific Decadal Oscillation • Long-lived variation in climate over the North Pacific and North America • Sea-surface temperatures fluctuate between the north central Pacific and the west coast of North America. • During a PDO warm phase, SST are lower than usual over the broad central interior of the North Pacific and above average in a narrow strip along the coasts of Alaska, western Canada, and the Pacific Northwest. • During a PDO cold phase, SST are higher in the North Pacific interior and lower along the coast. • Key to the climatic impact of PDO is the strength of the subpolar Aleutian low. • During a PDO warm phase, the Aleutian low is well developed and its strong counterclockwise winds steer mild and relatively dry air masses into the Pacific Northwest. • During a PDO cold phase, the Aleutian cyclone is weaker so that cold, moist air masses more frequently invade the Pacific Northwest.
Conclusions • El Niño and La Niña involve interactions between the tropical Pacific Ocean and atmosphere. • Short term fluctuations in climate induced by El Niño and La Niña as well as the longer-term NAO, AO, and PDO are superimposed on much longer period variations in climate that have longer lasting impacts on the Earth system.